Old Pintool Upgrade with newest pin

编译Old Pintool with newest pin

常见的问题:

  1. crt 相关的头文件的使用
  2. USIZE不再被定义

主要原因是头文件的include的使用不同,还有一些接口的改变。

分析基于inscount0.so的simple test pintool的make流程

1
2
3
4
5
6
7
8
9
10
11
12
13
14
15
16
17
18
19
20
21
22
23
24
25
26
27
28
29
30
31
32
33
34
35
$ make obj-intel64/inscount0.so
g++
# Warning Options
-Wall -Werror -Wno-unknown-pragmas -Wno-dangling-pointer
# Program Instrumentation Options
-fno-stack-protector
# Code-Gen-Options
-fno-exceptions -funwind-tables -fasynchronous-unwind-tables -fPIC
# C++ Dialect
-fabi-version=2 -faligned-new -fno-rtti
# define
-DPIN_CRT=1 -DTARGET_IA32E -DHOST_IA32E -DTARGET_LINUX
# include
-I../../../source/include/pin
-I../../../source/include/pin/gen
-isystem /staff/shaojiemike/Download/pin-3.28-98749-g6643ecee5-gcc-linux/extras/cxx/include
-isystem /staff/shaojiemike/Download/pin-3.28-98749-g6643ecee5-gcc-linux/extras/crt/include
-isystem /staff/shaojiemike/Download/pin-3.28-98749-g6643ecee5-gcc-linux/extras/crt/include/arch-x86_64
-isystem /staff/shaojiemike/Download/pin-3.28-98749-g6643ecee5-gcc-linux/extras/crt/include/kernel/uapi
-isystem /staff/shaojiemike/Download/pin-3.28-98749-g6643ecee5-gcc-linux/extras/crt/include/kernel/uapi/asm-x86
-I../../../extras/components/include
-I../../../extras/xed-intel64/include/xed
-I../../../source/tools/Utils
-I../../../source/tools/InstLib
# Optimization Options
-O3 -fomit-frame-pointer -fno-strict-aliasing
-c -o obj-intel64/inscount0.o inscount0.cpp

g++ -shared -Wl,--hash-style=sysv ../../../intel64/runtime/pincrt/crtbeginS.o -Wl,-Bsymbolic -Wl,--version-script=../../../source/include/pin/pintool.ver -fabi-version=2
-o obj-intel64/inscount0.so obj-intel64/inscount0.o
-L../../../intel64/runtime/pincrt
-L../../../intel64/lib
-L../../../intel64/lib-ext
-L../../../extras/xed-intel64/lib
-lpin -lxed ../../../intel64/runtime/pincrt/crtendS.o -lpindwarf -ldl-dynamic -nostdlib -lc++ -lc++abi -lm-dynamic -lc-dynamic -lunwind-dynamic

对应的makefile规则在source/tools/Config/makefile.default.rules

1
2
3
4
5
6
# Build the intermediate object file.
$(OBJDIR)%$(OBJ_SUFFIX): %.cpp
$(CXX) $(TOOL_CXXFLAGS) $(COMP_OBJ)$@ $<
# Build the tool as a dll (shared object).
$(OBJDIR)%$(PINTOOL_SUFFIX): $(OBJDIR)%$(OBJ_SUFFIX)
$(LINKER) $(TOOL_LDFLAGS) $(LINK_EXE)$@ $< $(TOOL_LPATHS) $(TOOL_LIBS)
  1. how to solve the UINT64 undefined bug: inscount0.cpp include pin.H which includes types_foundation.PH

与基于 scons的编译流程的对比

由于old pintool 基于 pin2.14。作为对比也分析inscount0.so的编译过程

1
2
3
4
5
6
7
8
9
10
11
12
13
14
15
16
17
g++ 
# Warning Options
-Wall -Werror -Wno-unknown-pragmas
# Program Instrumentation Options
-fno-stack-protector
# Code-Gen-Options
-fPIC
# define
-DBIGARRAY_MULTIPLIER=1 -DTARGET_IA32E -DHOST_IA32E -DTARGET_LINUX
-I../../../source/include/pin
-I../../../source/include/pin/gen
-I../../../extras/components/include
-I../../../extras/xed-intel64/include
-I../../../source/tools/InstLib
# Optimization Options
-O3 -fomit-frame-pointer -fno-strict-aliasing
-c -o obj-intel64/inscount0.o inscount0.cpp

同时multipim 的scons的编译细节如下,去除与pin无关的参数:

1
2
3
4
5
6
7
8
9
10
11
12
13
14
15
16
17
18
19
20
21
22
23
24
25
26
27
28
29
g++
# Warning Options
-Wall -Wno-unknown-pragmas
# c++ language
-std=c++0x
# Code-Gen-Options
-fPIC
# debug
-g
# Program Instrumentation Options
-fno-stack-protector
# Preprocessor Options ???TODO:
-MMD
# machine-dependent
-march=core2
# C++ Dialect
-D_GLIBCXX_USE_CXX11_ABI=0
-fabi-version=2
# define
-DBIGARRAY_MULTIPLIER=1 -DUSING_XED
-DTARGET_IA32E -DHOST_IA32E -DTARGET_LINUX
-DPIN_PATH="/staff/shaojiemike/github/MultiPIM_icarus0/pin/intel64/bin/pinbin" -DZSIM_PATH="/staff/shaojiemike/github/MultiPIM_icarus0/build/opt/libzsim.so" -DMT_SAFE_LOG
-Ipin/extras/xed-intel64/include
-Ipin/source/include/pin
-Ipin/source/include/pin/gen
-Ipin/extras/components/include
# Optimization Options
-O3 -funroll-loops -fomit-frame-pointer
-c -o build/opt/simple_core.os build/opt/simple_core.cpp

STEP1: update define and include path order

对比后,pin3.28 相对 pin2.14 编译时,

  • 加入了新定义 -DPIN_CRT=1
  • include path and order changed a lot
  • 编译选项也有改变(low influence)

STEP2: code change for include

1
2
3
4
5
// pin/extras/crt/include/freebsd/3rd-party/include/elf.h
> typedef uint16_t Elf32_Section;
> typedef uint16_t Elf64_Section;
// /usr/include/wordexp.h
remove __THROW

STEP3: ld errors

First apply the two change to old pintool

需要进一步的研究学习

暂无

遇到的问题

暂无

开题缘由、总结、反思、吐槽~~

参考文献

上面回答部分来自ChatGPT-3.5,没有进行正确性的交叉校验。

Intel Pin

简介

Pin 是一个动态二进制插桩工具:

  • 支持 Linux, macOS 和 Windows 操作系统以及可执行程序。
  • Pin可以通过pintools在程序运行期间动态地向可执行文件的任意位置插入任意代码(C/C++),也可以attach到一个正在运行的进程。
  • Pin 提供了丰富的API,可以抽象出底层指令集特性,并允许将进程的寄存器数据等的上下文信息作为参数传递给注入的代码。Pin会自动存储和重置被注入代码覆盖的寄存器,以恢复程序的继续运行。对符号和调试信息也可以设置访问权限。
  • Pin内置了大量的样例插桩工具的源码,包括基本块分析器、缓存模拟器、指令跟踪生成器等,根据自己的实际需求进行自定义开发也十分方便。

特点

  • 只是它的输入不是字节码,而是可执行文件的执行汇编代码(机械码)。
  • Pin 对所有实际执行的代码进行插桩,但是如果指令没有被执行过,就一定不会被插桩。
  • 工作在操作系统之上,所以只能捕获用户级别的指令。
  • 由于Pintool的编译十分自由,Pin不打算提供多线程插桩的支持。
  • 同时有3个程序运行:应用程序本身、Pin、Pintool。
    • 应用程序是被插桩的对象、Pintool包含了如何插桩的规则(用户通过API编写的插入位置和内容)
    • 三者共享同一个地址空间,但不共享库,避免了冲突。 Pintool 可以访问可执行文件的全部数据,还会与可执行文件共享 fd 和其他进程信息。

pin

基本原理

Pin机制类似Just-In-Time (JIT) 编译器,Trace插桩的基本流程(以动态基本块BBLs为分析单位):

  • Pin 会拦截可执行文件的第一条指令,然后对从该指令开始的后续的指令序列重新“compile”新的代码,并执行
  • Pin 在分支退出代码序列时重新获得控制权限,基于分支生成更多的代码,然后继续运行。

动态基本块BBLs

通过一个例子来说明动态基本块BBLs与 汇编代码的BB的区别

1
2
3
4
5
6
7
8
9
switch(i)
{
case 4: total++;
case 3: total++;
case 2: total++;
case 1: total++;
case 0:
default: break;
}

上述代码会编译成下面的汇编, 对于实际执行时跳转从.L7进入的情况,BBLs包括四条指令,但是BB只会包括一条。

1
2
3
4
5
6
7
8
.L7:
addl $1, -4(%ebp)
.L6:
addl $1, -4(%ebp)
.L5:
addl $1, -4(%ebp)
.L4:
addl $1, -4(%ebp)

Pin会将cpuid, popf and REP prefixed 指令在执行break 成很多BBLs,导致执行的基本块比预想的要多。(主要原因是这些指令有隐式循环,所以Pin会将其拆分成多个BBLs)

Download

  1. Download the kit from Intel website
  2. Because the compatibility problem may you should install pin with archlinux package

Installation

This part is always needed by pintool, for example Zsim, Sniper.

When you meet the following situation, you should consider update your pin version even you can ignore this warning by use flags like -ifeellucky under high compatibility risk.

1
2
3
shaojiemike@snode6 ~/github/ramulator-pim/zsim-ramulator/pin  [08:05:47]
> ./pin
E: 5.4 is not a supported linux release

because this will easily lead to the problem

1
Pin app terminated abnormally due to signal 6. # or signal 4.

Install pintool(zsim) by reconfig pin version

  1. My first idea is try a compatible pin version (passd a simple test pintool, whatever) instead of the old pin.
    1. Find the suitable simpler pintool can reproduce the situation (old pin failed, but newest pin is passed)
      1. TODO: build(fix pin2.14 CXX_ABI compatibility bug), test suitability
  2. debug the pin tool in details (See in another blog)

插桩粒度

  • Trace instrumentation mode:以动态基本块BBLs为分析单位
  • Instruction instrumentation mode:以指令为分析单位
  • 其余粒度/角度,这些模式通过“缓存”插装请求来实现,因此会产生空间开销,这些模式也被称为预先插装
    • Image instrumentation mode: 通过前提知道需要执行的所有代码,能绘制出全局的插桩情况图
    • Routine instrumentation mode: 理解为函数级插桩,可以对目标程序所调用的函数进行遍历,并在每一个routine中对instruction做更细粒度的遍历。
    • 两者都是在IMG加载时提前插桩,所有不一定routine会被执行。

范围image, section, routine, trace, basic block, instruction的含义和运行时关系

  • image包含section,section包含routine(理由:SEC_Img()RTN_Sec(),后面的静态遍历IMG中指令条数的代码也能说明)
  • routine指的是程序中的函数或子程序,trace指的是程序执行过程中的一条路径,basic block指的是一段连续的指令序列,其中没有跳转指令,instruction指的是程序中的一条指令。
  • 在程序执行时,一个routine可以包含多个trace,一个trace可以包含多个basic block,一个basic block可以包含多个instruction。
1
2
3
4
5
6
7
8
9
10
11
12
13
14
15
16
17
for (SEC sec = IMG_SecHead(img); SEC_Valid(sec); sec = SEC_Next(sec))
{
for (RTN rtn = SEC_RtnHead(sec); RTN_Valid(rtn); rtn = RTN_Next(rtn))
{
// Prepare for processing of RTN, an RTN is not broken up into BBLs,
// it is merely a sequence of INSs
RTN_Open(rtn);

for (INS ins = RTN_InsHead(rtn); INS_Valid(ins); ins = INS_Next(ins))
{
count++;
}

// to preserve space, release data associated with RTN after we have processed it
RTN_Close(rtn);
}
}

API

最重要的是

  • 插桩机制(instrumentation code):插入位置,在什么位置插入什么样的代码
  • 分析代码(analysis code):插入内容,在插桩点执行的代码 (和上一点的区别是什么???)

插桩机制(instrumentation code)

  • TRACE_AddInstrumentFunction Add a function used to instrument at trace granularity
    • BBL粒度插桩相关API
  • INS_AddInstrumentFunction() Add a function used to instrument at instruction granularity
    • 指令粒度插桩相关API
  • IMG_AddInstrumentFunction() Use this to register a call back to catch the loading of an image
  • 插桩不仅可以对每个指令插桩,还可以通过分类筛选后,只对符合要求的指令进行插桩
    • 比如,使用INS_InsertPredicatedCall()

遍历所有的指令

1
2
3
4
5
// Forward pass over all instructions in bbl
for( INS ins= BBL_InsHead(bbl); INS_Valid(ins); ins = INS_Next(ins) )

// Forward pass over all instructions in routine
for( INS ins= RTN_InsHead(rtn); INS_Valid(ins); ins = INS_Next(ins) )

遍历trace内BBLs

1
2
3
4
5
6
// Visit every basic block  in the trace
for (BBL bbl = TRACE_BblHead(trace); BBL_Valid(bbl); bbl = BBL_Next(bbl))
{
// Insert a call to docount before every bbl, passing the number of instructions
BBL_InsertCall(bbl, IPOINT_BEFORE, (AFUNPTR)docount, IARG_UINT32, BBL_NumIns(bbl), IARG_END);
}

遍历指令里的memOperands

1
2
3
4
5
6
7
UINT32 memOperands = INS_MemoryOperandCount(ins);

// Iterate over each memory operand of the instruction.
for (UINT32 memOp = 0; memOp < memOperands; memOp++){
if (INS_MemoryOperandIsRead(ins, memOp)||INS_MemoryOperandIsWritten(ins, memOp)
//xxx
}

Pintool

最重要的是

  • 插桩机制(instrumentation code):插入位置,在什么位置插入什么样的代码
  • 分析代码(analysis code):插入内容,在插桩点执行的代码 (和上一点的区别是什么???)

Pintool代码

示例分析

1
2
3
4
5
6
7
8
9
10
11
12
13
14
15
16
17
18
19
20
21
22
23
24
25
26
27
// IPOINT_BEFORE 时运行的分析函数
VOID printip(VOID* ip) { fprintf(trace, "%p\n", ip); }

// Pin calls this function every time a new instruction is encountered
VOID InstructionFuc(INS ins, VOID* v)
{
// Insert a call to printip before every instruction, and pass it the IP
// IARG_INST_PTR:指令地址 一类的全局变量???
INS_InsertCall(ins, IPOINT_BEFORE, (AFUNPTR)printip, IARG_INST_PTR, IARG_END);
}

int main(int argc, char* argv[])
{
// Initialize pin
if (PIN_Init(argc, argv)) return Usage();

// 登记InstructionFuc为以指令粒度插桩时每条指令触发的函数
INS_AddInstrumentFunction(InstructionFuc, 0);

// 登记PrintFuc为程序结束时触发的函数
PIN_AddFiniFunction(PrintFuc, 0);

// 部署好触发机制后开始运行程序
PIN_StartProgram();

return 0;
}

Debug pintool

目标:以样例插桩工具的源码为对象,熟悉pin的debug流程。

官方教程为例子:

1
2
3
4
5
6
7
uname -a #intel64
cd source/tools/ManualExamples
# source/tools/Config/makefile.config list all make option
make all OPT=-O0 DEBUG=1 TARGET=intel64 |tee make.log|my_hl
# or just select one: make obj-intel64/inscount0.so
# $(OBJDIR)%$(PINTOOL_SUFFIX) - Default rule for building tools.
# Example: make obj-intel64/mytool.so

测试运行

1
../../../pin -t obj-intel64/inscount0.so -- ./a.out #正常统计指令数 to inscount.out

下面介绍Pin 提供的debug工具:

首先创建所需的-gstack-debugger.so和应用fibonacci.exe

1
2
cd source/tools/ManualExamples
make OPT=-O0 DEBUG=1 stack-debugger.test

其中OPT=-O0选项来自官方文档Using Fast Call Linkages小节,说明需要OPT=-O0选项来屏蔽makefile中的-fomit-frame-pointer选项,使得GDB能正常显示stack trace(函数堆栈?)

Debug application in Pin JIT mode

1
2
3
4
$ ../../../pin -appdebug -t obj-intel64/stack-debugger.so -- obj-intel64/fibonacci.exe 1000
Application stopped until continued from debugger.
Start GDB, then issue this command at the prompt:
target remote :33030

使用pin的-appdebug选项,在程序第一条指令前暂停,并启动debugger窗口。在另一个窗口里gdb通过pid连接:

1
2
3
4
$ gdb fibonacci #如果没指定应用obj-intel64/fibonacci.exe
(gdb) target remote :33030 #连接gdb端口
(gdb) file obj-intel64/fibonacci.exe #如果没指定应用, 需要指定程序来加载symbols
(gdb) b main #continue 等正常操作

Pintool添加自定义debug指令

能够在上一小节的debug窗口里,通过自定义debug指令打印自定义程序相关信息(比如当前stack使用大小)

Pintool设置满足条件时break并启动debug窗口

Pintool “stack-debugger” 能够监控每条分配stack空间的指令,并当stack使用达到阈值时stop at a breakpoint。

这功能由两部分代码实现,一个是插桩代码,一个是分析代码。

1
2
3
4
5
6
7
8
9
10
11
12
13
14
15
16
static VOID Instruction(INS ins, VOID *)
{
if (!EnableInstrumentation) // ROI(Region of interest)开始插桩测量
return;

if (INS_RegWContain(ins, REG_STACK_PTR)) //判断指令是不是会改变stack指针(allocate stack)
{
IPOINT where = IPOINT_AFTER;
if (!INS_IsValidForIpointAfter(ins))
where = IPOINT_TAKEN_BRANCH; //寻找stack空间判断函数插入位置(指令执行完的位置)。如果不是after, 就是taken branch

INS_InsertIfCall(ins, where, (AFUNPTR)OnStackChangeIf, IARG_REG_VALUE, REG_STACK_PTR,
IARG_REG_VALUE, RegTinfo, IARG_END); // 插入OnStackChangeIf函数,如果OnStackChangeIf()返回non-zero, 执行下面的DoBreakpoint函数
INS_InsertThenCall(ins, where, (AFUNPTR)DoBreakpoint, IARG_CONST_CONTEXT, IARG_THREAD_ID, IARG_END);
}
}

所需的两个函数的分析代码如下:

1
2
3
4
5
6
7
8
9
10
11
12
13
14
15
16
17
18
19
20
21
22
23
24
25
26
27
28
29
30
31
32
33
34
35
36
37
38
39
40
41
42
43
44
static ADDRINT OnStackChangeIf(ADDRINT sp, ADDRINT addrInfo)
{
TINFO *tinfo = reinterpret_cast<TINFO *>(addrInfo);

// The stack pointer may go above the base slightly. (For example, the application's dynamic
// loader does this briefly during start-up.)
//
if (sp > tinfo->_stackBase)
return 0;

// Keep track of the maximum stack usage.
//
size_t size = tinfo->_stackBase - sp;
if (size > tinfo->_max)
tinfo->_max = size; //更新stack使用大小

// See if we need to trigger a breakpoint.
//
if (BreakOnNewMax && size > tinfo->_maxReported)
return 1;
if (BreakOnSize && size >= BreakOnSize)
return 1;
return 0;
}

static VOID DoBreakpoint(const CONTEXT *ctxt, THREADID tid)
{
TINFO *tinfo = reinterpret_cast<TINFO *>(PIN_GetContextReg(ctxt, RegTinfo));

// Keep track of the maximum reported stack usage for "stackbreak newmax".
//
size_t size = tinfo->_stackBase - PIN_GetContextReg(ctxt, REG_STACK_PTR);
if (size > tinfo->_maxReported)
tinfo->_maxReported = size;

ConnectDebugger(); // Ask the user to connect a debugger, if it is not already connected.

// Construct a string that the debugger will print when it stops. If a debugger is
// not connected, no breakpoint is triggered and execution resumes immediately.
//
tinfo->_os.str("");
tinfo->_os << "Thread " << std::dec << tid << " uses " << size << " bytes of stack.";
PIN_ApplicationBreakpoint(ctxt, tid, FALSE, tinfo->_os.str());
}

OnStackChangeIf函数监控当前的stack使用并判断是否到达阈值。DoBreakpoint函数连接debugger窗口,然后触发breakpoint,并打印相关信息。

也可以使用-appdebug_enable参数,取消在第一条指令前开启GDB窗口的功能,而是在触发如上代码的break时,才开启GDB窗口的连接。

而上述代码中的ConnectDebugger函数实现如下:

1
2
3
4
5
6
7
8
9
10
11
12
13
14
15
16
17
18
19
20
21
static void ConnectDebugger()
{
if (PIN_GetDebugStatus() != DEBUG_STATUS_UNCONNECTED) //判断是不是已有debugger连接
return;

DEBUG_CONNECTION_INFO info;
if (!PIN_GetDebugConnectionInfo(&info) || info._type != DEBUG_CONNECTION_TYPE_TCP_SERVER) //PIN_GetDebugConnectionInfo()获取GDB所需的tcp连接端口
return;

*Output << "Triggered stack-limit breakpoint.\n";
*Output << "Start GDB and enter this command:\n";
*Output << " target remote :" << std::dec << info._tcpServer._tcpPort << "\n";
*Output << std::flush;

if (PIN_WaitForDebuggerToConnect(1000*KnobTimeout.Value())) //等待其余GDB窗口的连接
return;

*Output << "No debugger attached after " << KnobTimeout.Value() << " seconds.\n";
*Output << "Resuming application without stopping.\n";
*Output << std::flush;
}

Tips for Debugging a Pintool

这部分讲述了如何debug Pintool中的问题。(对Pintool的原理也能更了解

为此,pin使用了-pause_tool n 暂停n秒等待gdb连接。

1
2
3
4
5
6
7
8
../../../pin -pause_tool 10 -t /staff/shaojiemike/github/sniper_PIMProf/pin_kit/source/tools/ManualExamples/obj-intel64/stack-debugger.so -- obj-intel64/fibonacci.exe 1000
Pausing for 10 seconds to attach to process with pid 3502000
To load the debug info to gdb use:
*****************************************************************
set sysroot /not/existing/dir
file
add-symbol-file /staff/shaojiemike/github/sniper_PIMProf/pin_kit/source/tools/ManualExamples/obj-intel64/stack-debugger.so 0x7f3105f24170 -s .data 0x7f31061288a0 -s .bss 0x7f3106129280
*****************************************************************

注意gdb对象既不是pin也不是stack-debugger.so,而是intel64/bin/pinbin。原因是intel64/bin/pinbinpin执行时的核心程序,通过htop监控可以看出。

1
2
3
# shaojiemike @ snode6 in ~/github/sniper_PIMProf/pin_kit/source/tools/ManualExamples on git:dev x [19:57:26]
$ gdb ../../../intel64/bin/pinbin
(gdb) attach 3502000

这时GDB缺少了stack-debugger.so的调试信息,需要手动添加。这里的add-symbol-file命令是在pin启动时打印出来的,直接复制粘贴即可。

1
2
3
4
5
6
7
8
9
(gdb) add-symbol-file /staff/shaojiemike/github/sniper_PIMProf/pin_kit/source/tools/ManualExamples/obj-intel64/stack-debugger.so 0x7f3105f24170 -s .data 0x7f31061288a0 -s .bss 0x7f3106129280
(gdb) b main #或者 b stack-debugger.cpp:94
gef➤ info b
Num Type Disp Enb Address What
1 breakpoint keep y <MULTIPLE>
1.1 y 0x00000000000f4460 <main> # 无法访问的地址,需要去除
1.2 y 0x00007f3105f36b65 in main(int, char**) at stack-debugger.cpp:94
(gdb) del 1.1
(gdb) c

个人尝试: 使用VSCODE调试Pintool

  • 想法:VSCODE的GDB也可以attach PID,理论上是可以的
  • 实际问题:VSCODE attach pid后,不会stopAtEntry,只会在已经设置好的断点暂停。但是无法访问到stack-debugger.so的调试信息,无法设置断点。

构建Pintool

  • 首先需要熟悉API
  • PinTool 编译需要自身的 Pin CRT(C RunTime)库,这个库是 Pin 提供的,可以在 Pin 安装目录下找到。

需要进一步的研究学习

暂无

遇到的问题

暂无

开题缘由、总结、反思、吐槽~~

参考文献

https://paper.seebug.org/1742/

https://software.intel.com/sites/landingpage/pintool/docs/98690/Pin/doc/html/index.html#APPDEBUG_UNIX

URLs

导言

frequently-used out-of-work urls

Read more

Postgraduate dormitory

高新区宿舍(男

西电梯间

宿舍走道

寝室内

洗漱台

淋雨间

卫生间(马桶(我们的变杂物间了

四人宿舍

某人的宿舍位(一定不是我的)

ps:实验室装修时的图

HDMI

HDMI

高清多媒体界面(英语:High Definition Multimedia Interface,缩写:HDMI)是一种全数字化影像和声音发送接口,可以发送未压缩的音频及视频信号。HDMI可以同时发送音频和视频信号,由于音频和视频信号采用同一条线材,大大简化系统线路的安装难度。

与DP的区别

HDMI是被设计来取代较旧的模拟信号影音发送接口。HDMI继承DVI的核心技术“传输最小化差分信号”TMDS,从本质上来说仍然是DVI的扩展。画面是以逐行的方式被发送,并在每一行与每祯画面发送完毕后加入一个特定的空白时间(类似模拟扫描线),并没有将数据“Micro-Packet Architecture(微数据包架构)”化,也不会只更新前后两帧画面改变的部分。每张画面在该更新时都会被完整的重新发送。

而DisplayPort一开始则面向液晶显示器开发,采用“Micro-Packet Architecture(微数据包架构)”传输架构,视频内容以数据包方式传送,这一点同DVI、HDMI等视频传输技术有着明显区别。

更多先进特性对比: https://www.cnbeta.com/articles/tech/1034975.htm

历史

HDMI 1.4

2009年5月28日提出,最高支持4K×2K(3840×2160p@24 Hz/25 Hz/30 Hz或4096×2160p@24 Hz)

HDMI 2.0

2013年9月4日提出

  1. 新增2160p@50 YCbCr 4:2:0、2160p@60 YCbCr 4:2:0(4K分辨率)
  2. 传输带宽18Gbit/s 支持4096*2160*60Hz

HDMI 2.1

2017年1月4日提出

  1. 支持的最大分辨率为 10K/120 Hz


比特率编码

在早期的DP和HDMI标注中,数字信号大多使用8b/10b的比特率编码进行传输。在8b/10b编码模式下,意味着每8位数据在实际传输中需要10位的传输带宽,而这些多出来的冗余用来确保信号的完整性,这意味着他们只有80%的理论带宽可以用来传输数据。

而在最新的协议下,DP 2.0采用128b/132b进行传输,编码效率效率提升到97%,而HDMI 2.1则采用16b/18b进行传输,编码效率为88.9%。

加上同代的DP接口一般都拥有更高的传输速率,所以最新一代DP接口相对HDMI的拥有更高的数据速率。

数据表示

每个像素都拥有红色,绿色和蓝色(RGB)这三个数据点,或者使用亮度,蓝色色度差和红色色度差(YCbCr / YPbPr)三个数据点

各种接口速率

查看电脑USB接口

接口驱动更新

???

软件的帧率

Windows

Android

实际应用

联想2020R7000

type c,同时支持dp1.2的视频输出 21.6Gbps

HDMI2.0 18Gbps

怎么算

小米的显示器是DP1.4的接口 10bits

但是实际是8bits 下需要的带宽为为3*8*3440*1440*100Hz=11888640000bps 3种颜色每个8位。

11888640000bps / 0.8 = 14860800000bps 也不对,哪里有问题

实际

买了根DP1.4的线,但是只有DP1.2的口

但是144Hz带不动,会花屏,或者闪烁。

需要进一步的研究学习

暂无

遇到的问题

暂无

开题缘由、总结、反思、吐槽~~

参考文献

https://zh.wikipedia.org/wiki/USB#%E6%A0%87%E5%87%86USB%E6%8E%A5%E5%8F%A3

https://www.cnbeta.com/articles/tech/1034975.htm

DP

DP

DisplayPort(简称DP)是一个由PC及芯片制造商联盟开发,视频电子标准协会(VESA)标准化的数字式视频接口标准。该接口免认证、免授权金,主要用于视频源与显示器等设备的连接,并也支持音频、USB和其他形式的资料。

用于取代传统的VGA、DVI。 DisplayPort是第一个依赖数据包化资料传输技术的显示连接端口。

历史

1.0

2006年5月发布。带宽10.8Gbps。DisplayPort 1.0的最大传输速度是8.64Gbit/s,长度是2米。已经废弃。

1.2

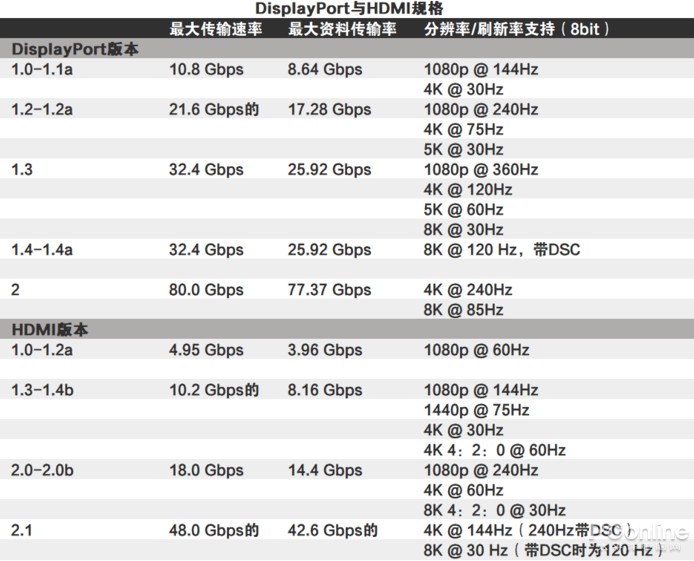
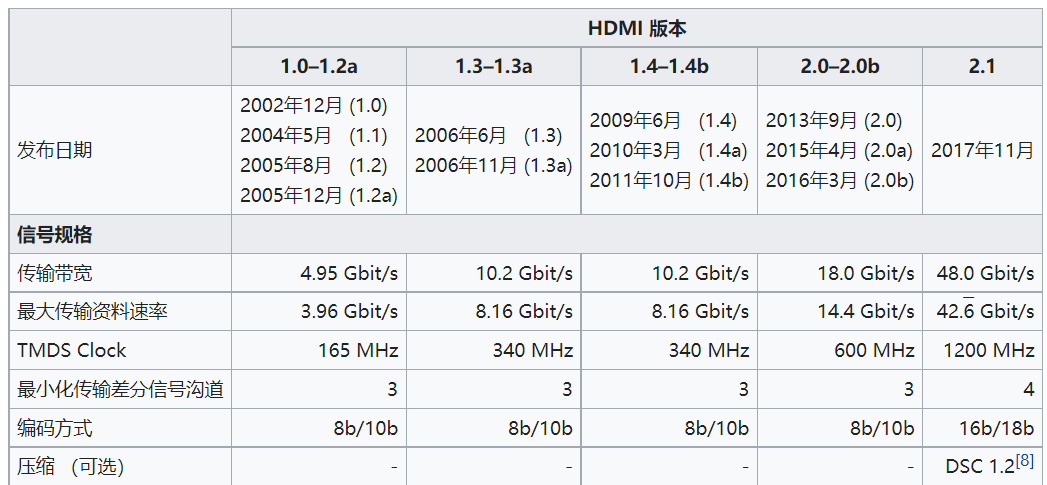
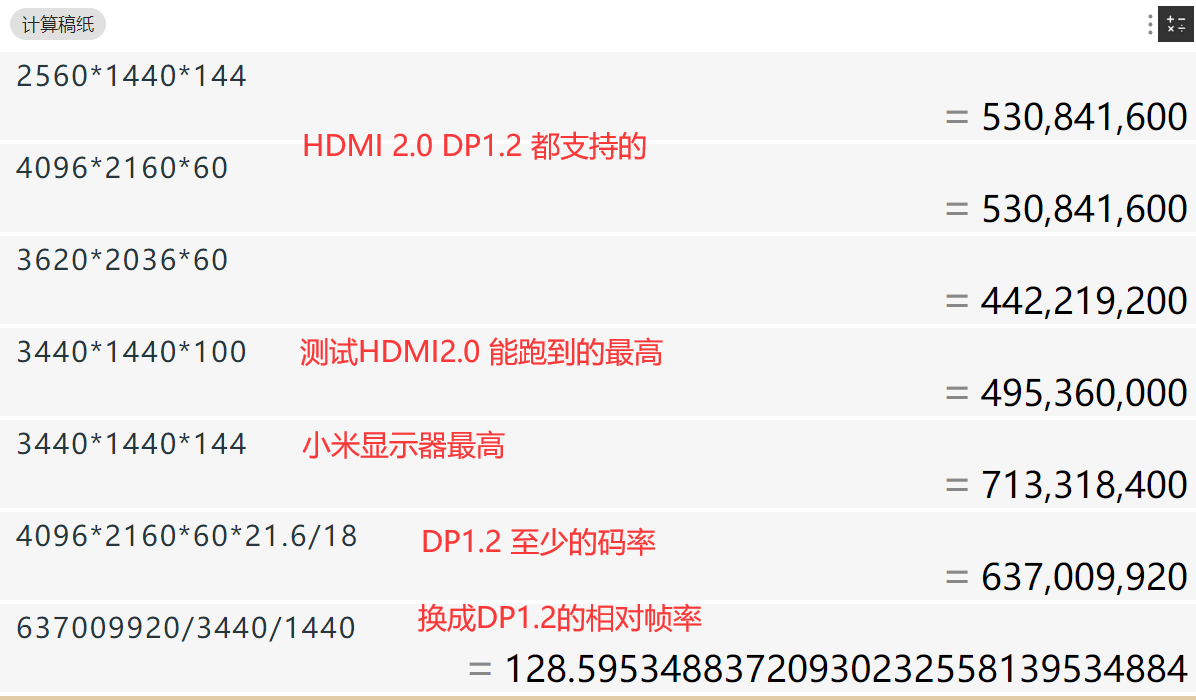
于2009年12月22日发布。它最大的改变是传输速度增加两倍到21.6Gbit/s(High Bit Rate 2(HBR2)mode),支持4K(4096X2160)60Hz,因此支授更高的分辨率、帧速率及色深。苹果公司设计的Mini DisplayPort亦兼容此标准。支持3D、支持多流(multi-streaming)。目前此版本是主流。

1.3

2014年9月15日,视频电子标准协会发布DisplayPort 1.3,带宽速度最高32.4 Gbps(HBR3),编码后有效带宽为25.92 Gbps,可支持4K(3840X2160)120hz、5K(5120X2880)60hz、8K(7680X4320)30hz。

1.4

2016年2月份最终版的DP 1.4连接端口规范,新标准基于2014年9月的DP 1.3规范,带宽不变但加入了显示压缩流(Display Stream Compression)技术、前向错误更正(Forward Error Correction)、高动态范围数据包(HDR meta transport),声道也提升到32声道1536 KHz采样率,一般情况下,DP1.4可提供4K 120Hz 8bit输出,若搭配DSC技术,可提供4K 144Hz 10bit输出。

DP1.4目前有严重BUG,无法进入bios或屏幕休眠后无法唤醒,20和30系显卡NVIDIA官方尚未放出修复更新,必须要显卡厂商自行修复,建议改用HDMI2.1

2.0

  1. 三倍数据带宽性能
    之前版本的DisplayPort v1.4a提供了32.4 Gbps的最大链路带宽,四个通道中的每一个都以8.1 Gbps / lane的链路速率运行。使用8b / 10b信道编码,相当于25.92 Gbps的最大有效载荷。

DP 2.0将最大链路速率提高到20 Gbps / lane,并具有更高效的128b / 132b信道编码,最大有效载荷为77.37 Gbps - 与DP 1.4a相比,增加了三倍。

这意味着DP 2.0是第一个以60 Hz刷新率支持8K分辨率(7680 x 4320)的标准,全彩色4:4:4分辨率,包括每像素30位(bpp),支持HDR-10。

  1. 单显示分辨率???
    一个16K(15360×8640)显示器@ 60Hz和30 bpp 4:4:4 HDR(带DSC)

    一个10K(10240×4320)显示器@ 60Hz和24 bpp 4:4:4(无压缩) 双显示分辨率

    两个8K(7680×4320)显示器@ 120Hz和30 bpp 4:4:4 HDR(带DSC)

    两个4K(3840×2160)显示@ 144Hz和24 bpp 4:4:4(无压缩) 三重显示分辨率

    三个10K(10240×4320)显示器@ 60Hz和30 bpp 4:4:4 HDR(带DSC)

    三个4K(3840×2160)显示@ 90Hz和30 bpp 4:4:4 HDR(无压缩)

特点

  1. 完全兼容现有HDMI1.4a标准和旧的HDMI标准。
  2. 支持USB Type-C。
  3. 支持144Hz刷新率
  4. 支持6、8、10、12与16位色深。
  5. 1080p的有效传输带宽保证长度为5米。
  6. 多屏幕输出
    DisplayPort 1.2支持MST(Multi-Stream Transport),单个DP可连接到多个显示器。要使用这项功能,显示器需要支持DP 1.2菊花链(Daisy-chaining),或使用MST Hub把DP一个拆成三个。

需要进一步的研究学习

暂无

遇到的问题

暂无

开题缘由、总结、反思、吐槽~~

参考文献

USB & Thunderbolt & Type-C

USB

通用串行总线(英语:Universal Serial Bus,缩写:USB)是连接计算机系统与外部设备的一种串口总线标准,也是一种输入输出接口的技术规范,被广泛地应用于个人电脑和移动设备等信息通讯产品。

最新一代的USB是USB4,传输速度为40Gbit/s。物理接头USB Type-A、Type-B接头分正反面,新型USB Type-C接头不分正反。

区分USB3.0

  1. 按颜色区分,接口内部是黑色的为USB2.0,蓝色或红色的为USB3.0
  2. 接口触点区分,USB2.0接口只有四个触点,而USB3.0有9个触点(外五内四)
    1. 4个(1个供电,2个数据,1个接地);USB 3.0拥有9个(另外4个提供给SuperSpeed技术);USB 3.1 Type-C拥有24个
  3. 还有一种是看接口标识,见下图

速率

接口样式


历史

USB 2.0

USB 2.0:2000年4月发布。增加更高的数据传输速率480Mbit/s(现在称作Hi-Speed,大约57MB/s),但受限于BOT传输协议和NRZI编码方式,实际最高传输速度只有35MByte/s左右。

USB 3.0(USB 3.1 Gen1/USB 3.2 Gen1)

USB 3.0于2008年11月发布,速度由480Mbps大幅提升到5Gbps。USB 3.0插座通常是蓝色的,并向下兼容USB 2.0和USB 1.x。USB 3.0引入了全双工传输,USB 1.x和USB 2.0则是半双工传输。

USB 3.1(USB 3.1 Gen2/USB 3.2 Gen2x1)

USB3.0推广小组于2013年7月31日宣布USB 3.1规格[10],传输速度提升为10Gb/s,比USB3.0的5Gb/s快上一倍,并向下兼容USB 2.0/1.0,如果要得到10Gb/s的传输速度仍需在主机、目标端同时具备对应的芯片才能达成,电力供应可高达100瓦。

USB Type-C接口

于2014年8月完成。与USB 3.1规格大致相同。但USB-C只是一个接口,不一定支持USB 3.x或Power Delivery(许多手机的Type-C仍然使用USB 2.0)

USB 3.2(USB 3.2 Gen2x2)

在USB Type-C接口上实现双通道,速度方面,使用USB 3.2主机连接USB 3.2存储设备,可以实现两条通道10Gbps的传输速度,理论上也就是相当接近于20Gbps。

另外,从USB 3.2开始,Type-C是唯一推荐的接口方案。

USB4

USB4项目集成Thunderbolt 3协议,USB4支持40Gbps的传输速度,固定Type-C口。

USB Type-C接口

特点

可选集成DisplayPort、HDMI、MHL。
可选集成Thunderbolt。
可选集成USB4。

Thunderbolt

Thunderbolt(又称“雷电”,苹果中国译为“雷雳”[4])是由英特尔发表的连接器标准,目的在于当作电脑与其他设备之间的通用总线,第一代与第二代接口是与Mini DisplayPort集成,较新的第三代开始改为与USB Type-C结合,并能提供电源。

历史

由于 Thunderbolt 1, 2使用的是苹果Mini Displayport,配件无法用在其他电子设备,普及程度远低于对手USB。

由于雷电协议需要额外的独立芯片支持,费用高昂。Intel决定把雷电协议开源给USB-IF。这间接促成了USB4的推出。
第三版(Thunderbolt 3)
2015年6月2日,COMPUTEX 2015 ,代号为Alpine Ridge,双倍带宽达到40 Gbit/s (5 GB/s)。Thunderbolt 3 物理接口改用USB Type-C。

需要进一步的研究学习

暂无

遇到的问题

暂无

开题缘由、总结、反思、吐槽~~

参考文献

Static Code Analysis

静态代码分析器的意义

在不运行程序的情况下,预测程序性能表现。得到估计时钟周期,资源占用情况,潜在的代码瓶颈等的分析。以便优化程序,或者为了更好的运行程序反过来对CPU的架构设计提出意见。

在预测的过程中,也会简单进行自动向量化,指令调度等工作。

比如你想看在arm架构下该程序下有什么瓶颈,但是你只有intel的机器,你就可以通过静态代码分析器来分析。但是当前的效果都不是太好。

已有的Static Code Analyzer

IACA

IACA (the Intel Architecture Code Analyzer) is a (2019: end-of-life) freeware, closed-source static analysis tool made by Intel

由于Intel对自己的处理器优化很了解,所有可以更好的预测。
比如 zero-idioms 和 micro-op fusions(聚合,将相邻指令变为一条指令)

zero-idioms —— The processor recognizes that certain instructions are independent of the prior value of the register if the two operand registers are the same. An instruction that subtracts a register from itself will always give zero, regardless of the previous value of the register.
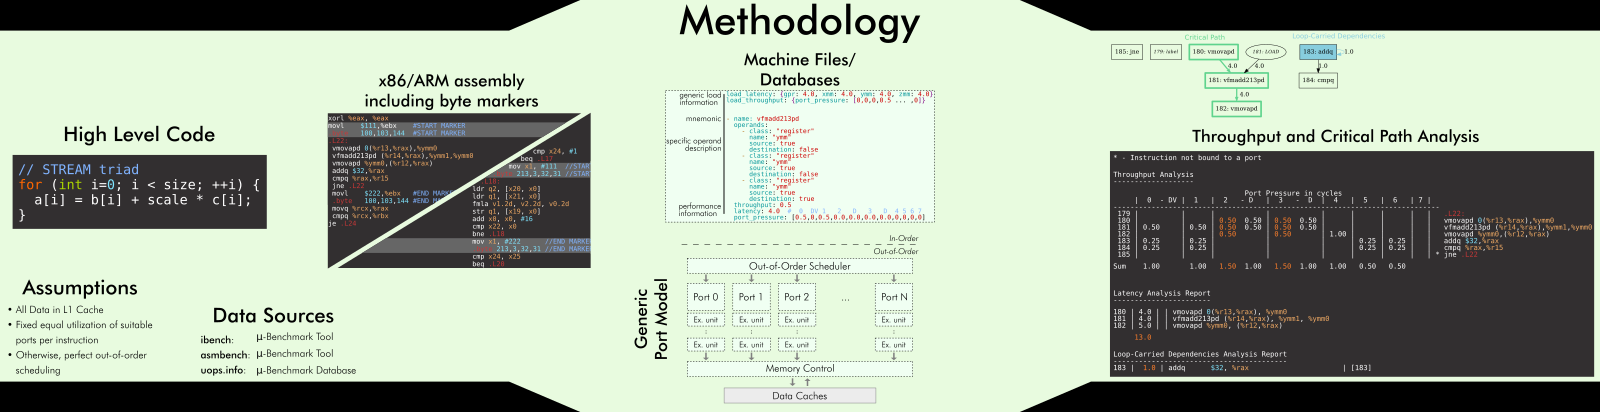
Ithemal

Ithemal (Instruction THroughput Estimator using MAchine Learning)
基于hierarchical LSTM–based 方法。基本块预测器,但是是黑盒。

Long short-term memory (LSTM) is an artificial recurrent neural network (RNN) architecture used in the field of deep learning.

应该是准确度最高的

LLVM-mca

LLVM Machine Code Analyzer
受到IACA启发的相似的工具,是乱序超标量(多条流水线,每周期可以完成2条以上指令,如下图)微架构模拟器。

使用了LLVM后端的调度模型参数。这种重用调度模型的选择对llvm cost 模型提供了经验。其准确性于调度模型有关。

OSACA

Open Source Architecture Code Analyzer

是IACA的开源替代,也和llvm-mca很像。是参数化的乱序模拟器,但是参数来自测量的指令查找表

cost model

LLVM 和GCC 也有cost model,但是是指令层面的,不是基本块层面的。

比如LLVM 至少有3个:

  1. a generic, per-instruction IR (Intermediate Representation) cost model for its target-independent optimizations
  2. one for instruction scheduling (the scheduling model [14] is also used by llvm-mca);
  3. another one for register allocation

基本概念

throughput

Predicting the (average) number of clock cycles a processor takes to execute a block of assembly instructions
in steady state

performance models / Processor performance models

指代静态代码分析器,就是别名。

需要进一步的研究学习

暂无

遇到的问题

暂无

开题缘由、总结、反思、吐槽~~

参考文献

https://github.com/RRZE-HPC/OSACA

Static Code Analyzer on Kunpeng Overview

Static Code Analyzer Overview

What Is Static Analysis?

一种通过在程序运行之前自动检查源代码的调试方法。

What Is Static Code Analysis?

经常和source code analysis结合(貌似sourcetail的代码结构分析?

可以分析addresses weaknesses漏洞

IPC - Instructions per cycles

Throughput and Critical Path Analysis

好吧,都是机密,就不写了。

Chen advise

提高访存的方法 C-AMAT

目标

机密

需要进一步的研究学习

暂无

遇到的问题

暂无

开题缘由、总结、反思、吐槽~~

参考文献