导言
虽然大型项目会使用cmake,手写makefile的情况比较少,但是基本语法还是要熟悉的。
It is all started with two confusing situation.
ps aux | grep -v process_name, the process is in Sl+ state. But the cpu usage is not zero.watch "ps aux |grep 3496617" always show the same cpu usage percentage, which is very confusing beacause htop always show up-down value. and pidstat -p 3516617 show cpu% less than 100%.并行算法设计(详细见陈国良教材)
设计并发程序的四个阶段(PCAM设计方法学):
编译器和硬件级别的,一般不会引起程序员的注意。[^1]
硬件推测是一种技术,通过它,处理器可以在不完全确定某些操作结果的情况下,提前执行后续指令。这种技术主要用于提高处理器的性能和执行效率。以下是硬件推测的几个关键方面:
这些推测性技术的共同目标是减少因等待数据依赖、分支决策或其他延迟而导致的空闲处理器周期。如果推测正确,这可以显著提高执行速度。然而,如果推测错误,处理器必须“倒回”并重新执行正确的指令路径,这可能导致性能损失。因此,现代处理器设计的一个关键方面是优化这些推测机制以最大限度地减少错误预测的影响。
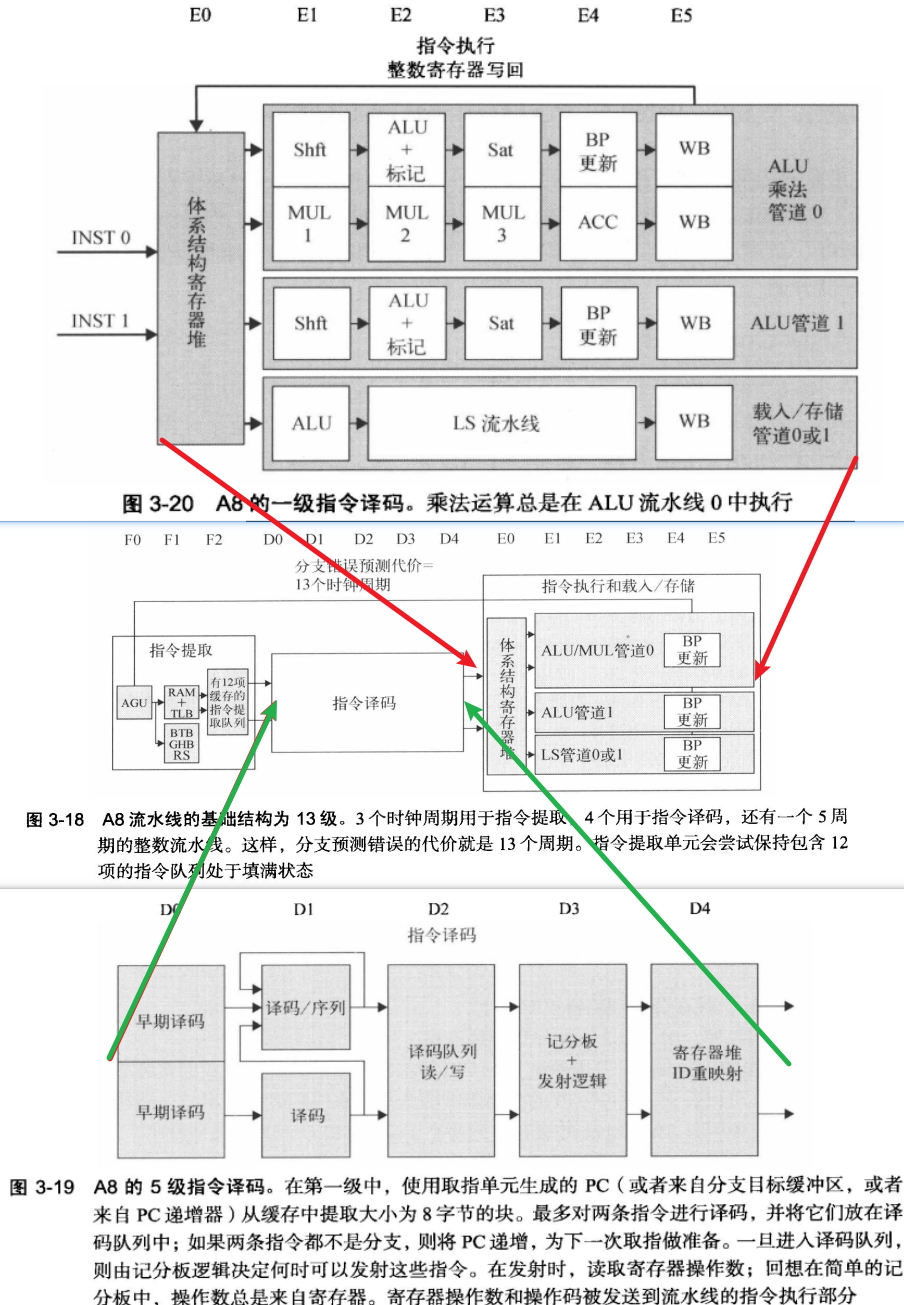
有多个功能单元和流水化单元。使得流水线能同时执行多个指令
乱序执行, 循序提交: 记分板 -> Tomasulo算法
重排缓存区ROB:保存已经执行完成,但是还没有提交的指令结果。是乱序执行处理器的核心组件之一。
三点作用:
多发射是一个更广泛的术语,指的是在一个时钟周期内发射(开始执行)多条指令的能力。
主要有三类:
超标量处理器通常具有多个执行单元,如多个整数、浮点和其他专用执行单元,以及复杂的调度和分支预测机制来支持同时处理多条指令。
VLIW(Very Long Instruction Word)是一种处理器架构设计,其特点是使用非常长的指令字来编码多个操作,这些操作可以在单个处理器周期内并行执行。VLIW架构的关键特征如下:
VLIW架构在某些特定的应用场景(如数字信号处理DSP)中效果显著,但在通用计算领域的适用性受到限制,主要是因为编译器在处理普通程序时面临更大的挑战来有效地利用指令级并行性。
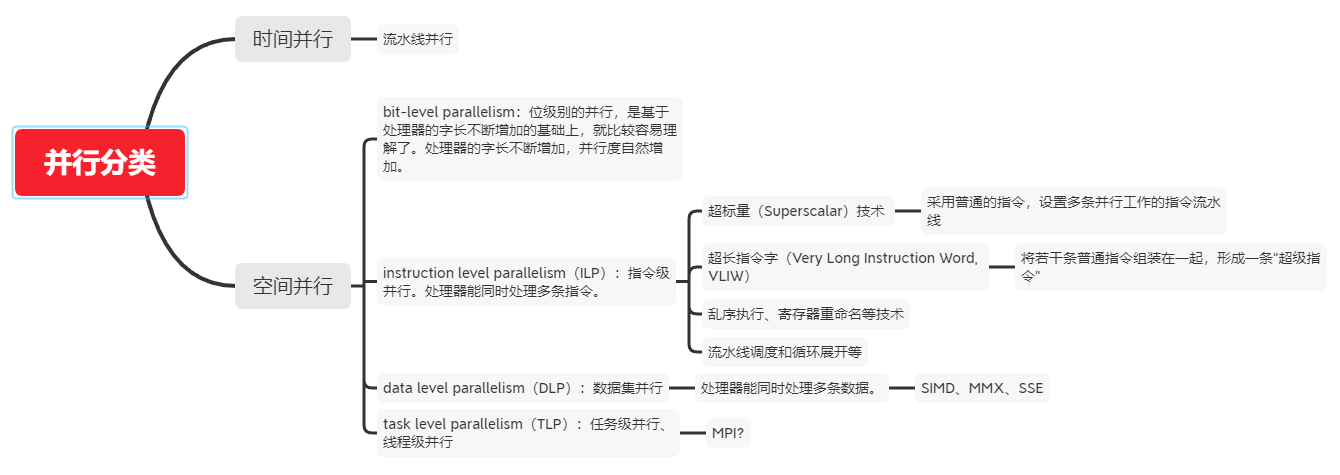
ILP 指令级并行
TLP 线程级并行
SMT 同步多线程(Simultaneous Multi-Threading,SMT)是一种在一个CPU 的时钟周期内能够执行来自多个线程的指令的硬件多线程技术。
CMP 单芯片多处理器(Chip multiprocessors)
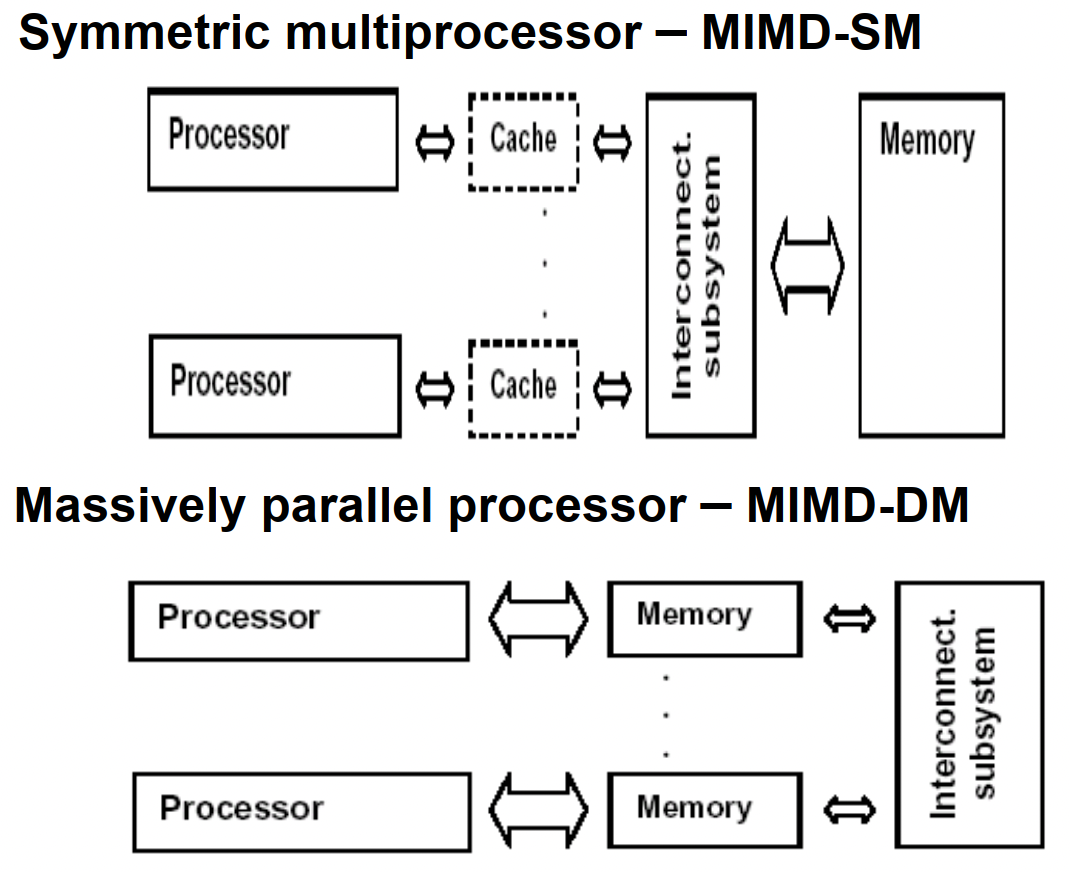
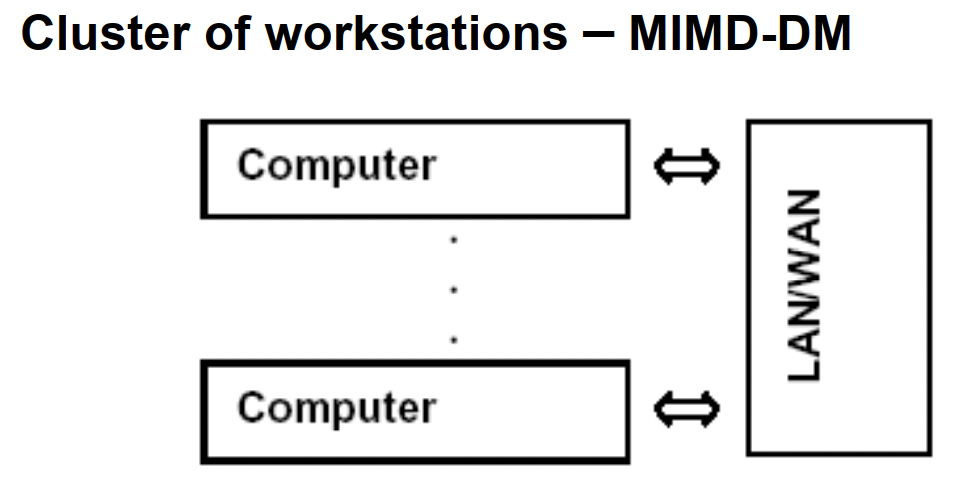
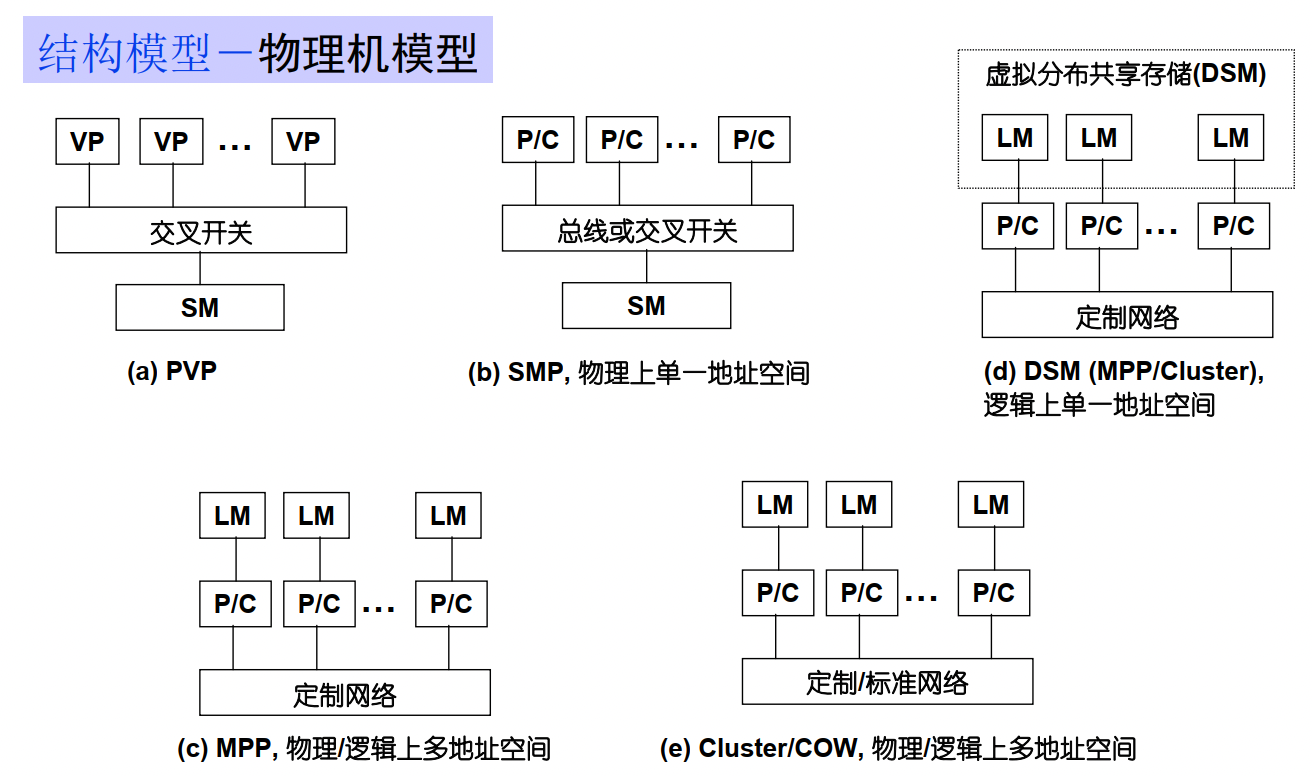
SM : shared Memory
LM : Local Memory
DM :distribute memory
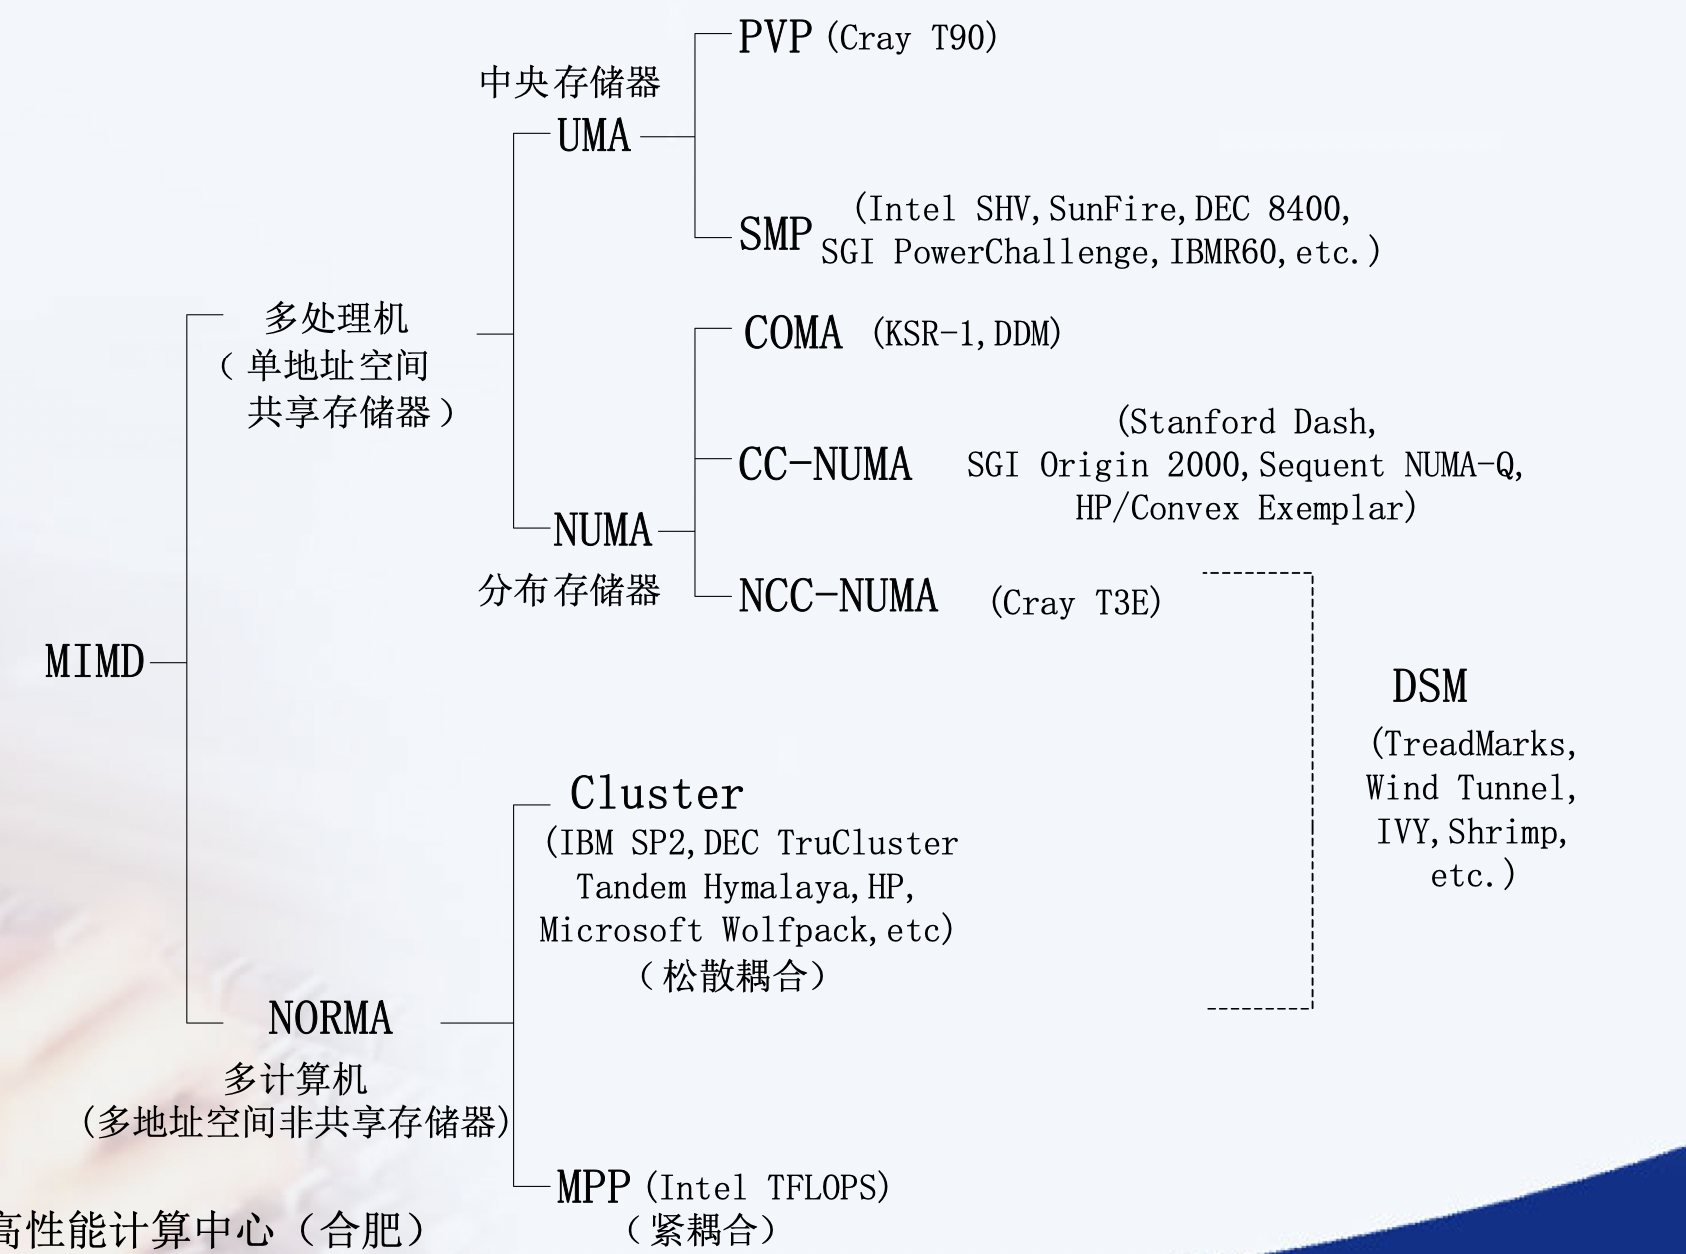
均匀访存模型(UMA)、非均匀访存模型(NUMA)、全高速缓存访存模型(COMA)、一致性高速缓存非均匀存储访问模型(CC-NUMA)和非远程存储访问模型(NORMA)。
UMA(Uniform Memory Access)均匀存储訪问:物理存储器被全部处理器均匀共享,全部处理器对全部SM訪存时间相同,每台处理器可带有快速私有缓存,外围设备共享。
NUMA非均匀存储訪问:共享的SM是由物理分布式的LM逻辑构成,处理器訪存时间不一样,訪问LM或CSM(群内共享存储器)内存储器比訪问GSM(群间共享存储器)快
COMA(Cache-Only MA)全快速缓存存储訪问:NUMA的特例、全快速缓存实现
CC-NUMA(Coherent-Cache NUMA)快速缓存一致性NUMA:NUMA+快速缓存一致性协议。实际是分布共享的DSM机器
NORMA(No-Remote MA)非远程存储訪问:无SM,全部LM私有。通过消息传递通信
NUMA : NUMA (non-uniform memory access) is a method of configuring a cluster of microprocessor in a multiprocessing system so that they can share memory locally, improving performance and the ability of the system to be expanded. NUMA is used in a symmetric multiprocessing ( SMP ) system.
在NUMA下,處理器存取它自己的本地記憶體的速度比非本地記憶體快一些。 非統一記憶體存取架構的特點是:被共享的記憶體物理上是分散式的,所有這些記憶體的集合就是全域位址空間。
Remote Direct Memory Access (RDMA) is an extension of the Direct Memory Access (DMA) technology, which is the ability to access host memory directly without CPU intervention. RDMA allows for accessing memory data from one host to another.
远程直接内存访问(英语:Remote Direct Memory Access,RDMA)是一种从一台计算机的内存到另一台计算机的内存的直接内存访问,而不涉及任何一台计算机的操作系统。这允许高吞吐量、低延迟联网,这在大规模并行计算机集群中特别有用。
重点是zero-copy, 不再需要机器缓存,然后拷贝传递信息。 InfiniBand网络默认支持,另一种就是RoCE
Most high performance computing clusters are nowadays composed of large multicore machines that expose Non-Uniform Memory Access (NUMA), and they are interconnected using modern communication paradigms, such as Remote Direct Memory Access (RDMA).
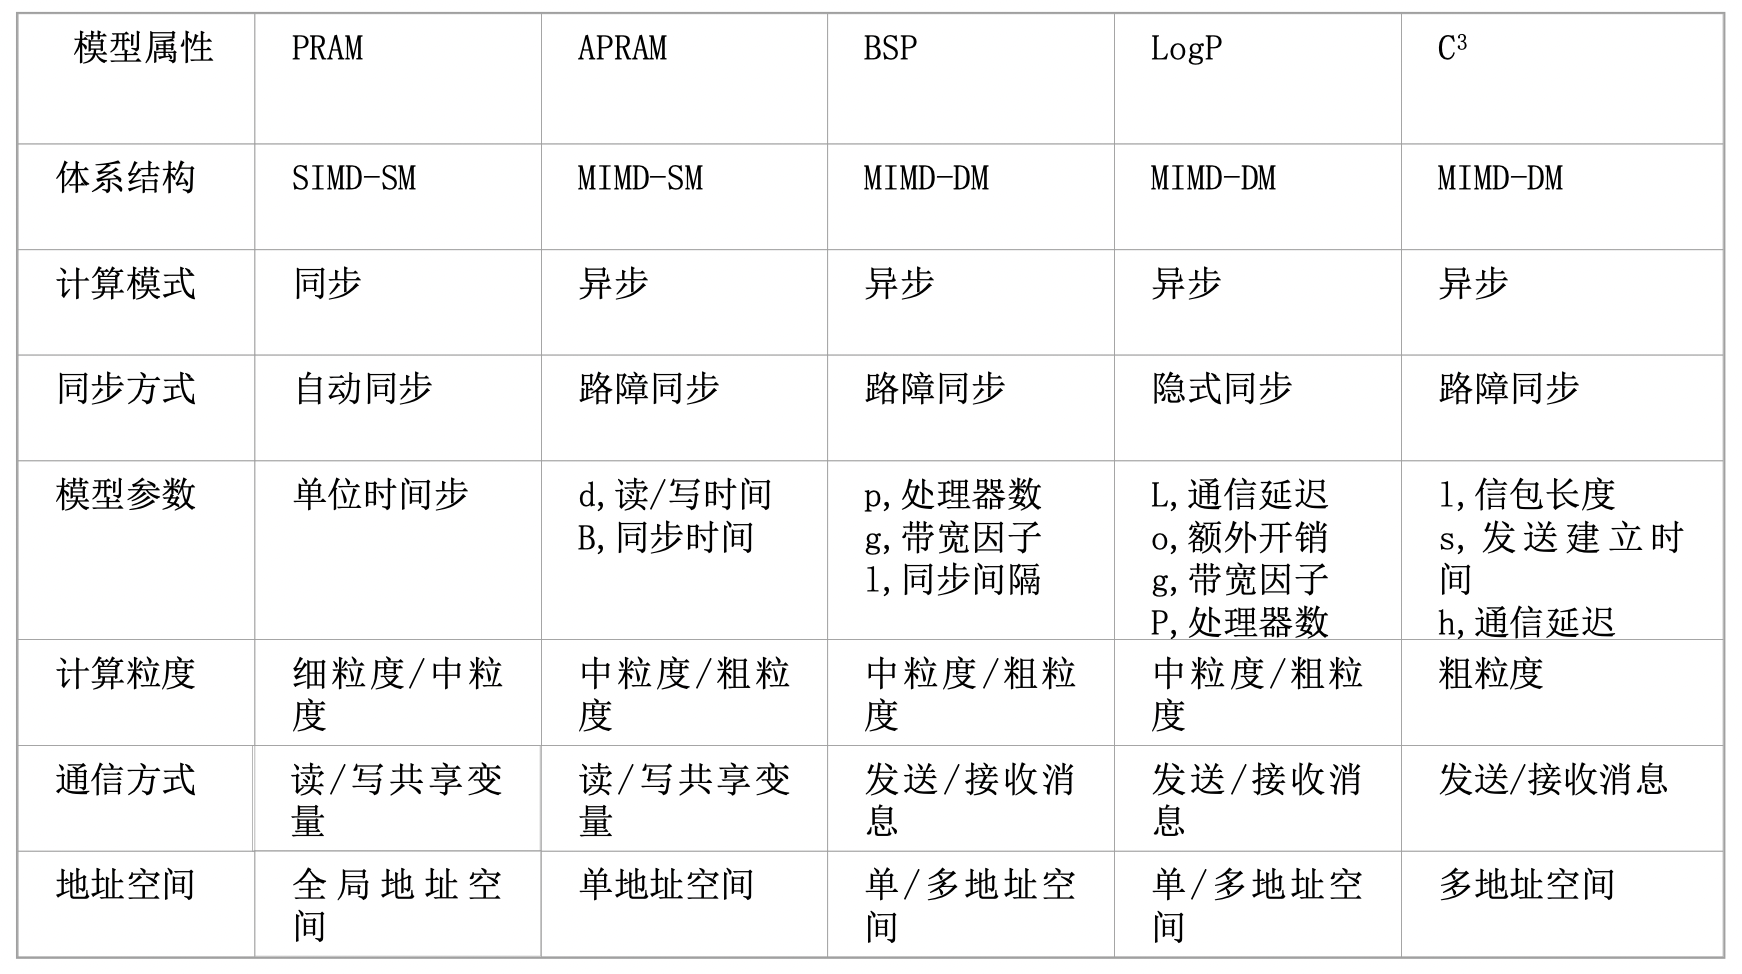
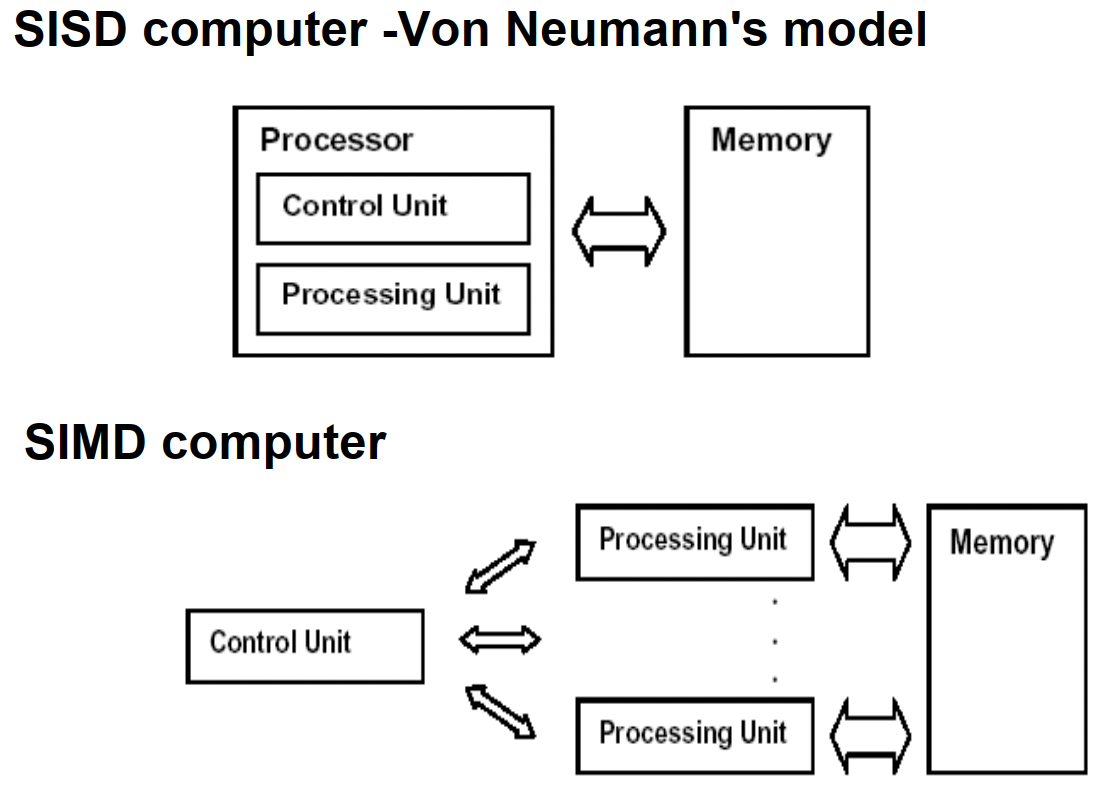
PRAM(Parallel Random Access Machine)模型是单指令流多数据流(SIMD)并行机中的一种具有共享存储的模型。
它假设有对其容量大小没有限制的一个共享存储器,并且有多个功能相同的处理器,在任意时刻处理器可以访问共享存储单元。根据是否可以同时读写,它又分为以下三类:PRAM-EREW,PRAM-CREW,PRAM-CRCW(其中C代表Concurrent,意为允许并发操作,E-代表Exclusive,意味排斥并发操作)。在PRAM中有一个同步时钟,所有的操作都是同步进行的。
具有局部存储器的PRAM模型称作LPRAM模型,具有异步时钟的PRAM模型称作APRAM模型。
在《并行算法的设计和分析》的第二十章-并行计算理论有额外的定义:
暂无
暂无
[^1]: 计算机体系结构 - 量化研究方法第5 版
参考中文文档
1 | sudo apt-get install npm |
1 | option = { |
暂无
暂无
ssh config & X11 & jump-machine
1 | Host node5 |
1 | sudo journalctl -u ssh --since "yesterday" |less |
windows use mobaxterm, mac use xquartz + iterms
1 | ssh -Y [email protected] |
在管理外网服务器时,出于安全等因素的考虑,我们一般不会把所有服务器都设置成可ssh直连,而是会从中挑选出一台机器作为跳板机,当我们想要连接外网服务器时,我们要先通过ssh登录到跳板机,再从跳板机登录到目标服务器。
1 | $ eval $(ssh-agent) |
1 | ssh -A [email protected] |
或者直接
1 | ssh -J [email protected] [email protected] |
这条命令将会首先连接到 [email protected] 的跳板机,然后再通过跳板机连接到 [email protected] 的目标服务器。
1 | scp -J [email protected] [email protected]:/path/to/source/file /path/to/destination/file |
这个命令将会通过 [email protected] 的跳板机从源文件 /path/to/source/file 复制数据到 [email protected] 的目标文件 /path/to/destination/file。
1 | Host <name> |
check is ssh use direct connect not use jump host
google check ssh gui x11 use jump host
https://www.ibm.com/support/pages/how-forward-x11-client-through-jump-host-back-pc-x-emulator
/etc/ssh/sshd_configxauthDISPLAY and XAUTHORITY will automatically be set to their proper values.DISPLAY is not set, it means ssh is not forwarding the X11 connection.ForwardX11 yes in ~/.ssh/configX11UseLocalhost yesvlab 能正常登录的情况下ssh -i D:\\PowerShell\\vlab-vm7096.pem [email protected]
有两种设置ssh config设置方法
1 | Host jumpSnode6Ipv4W |
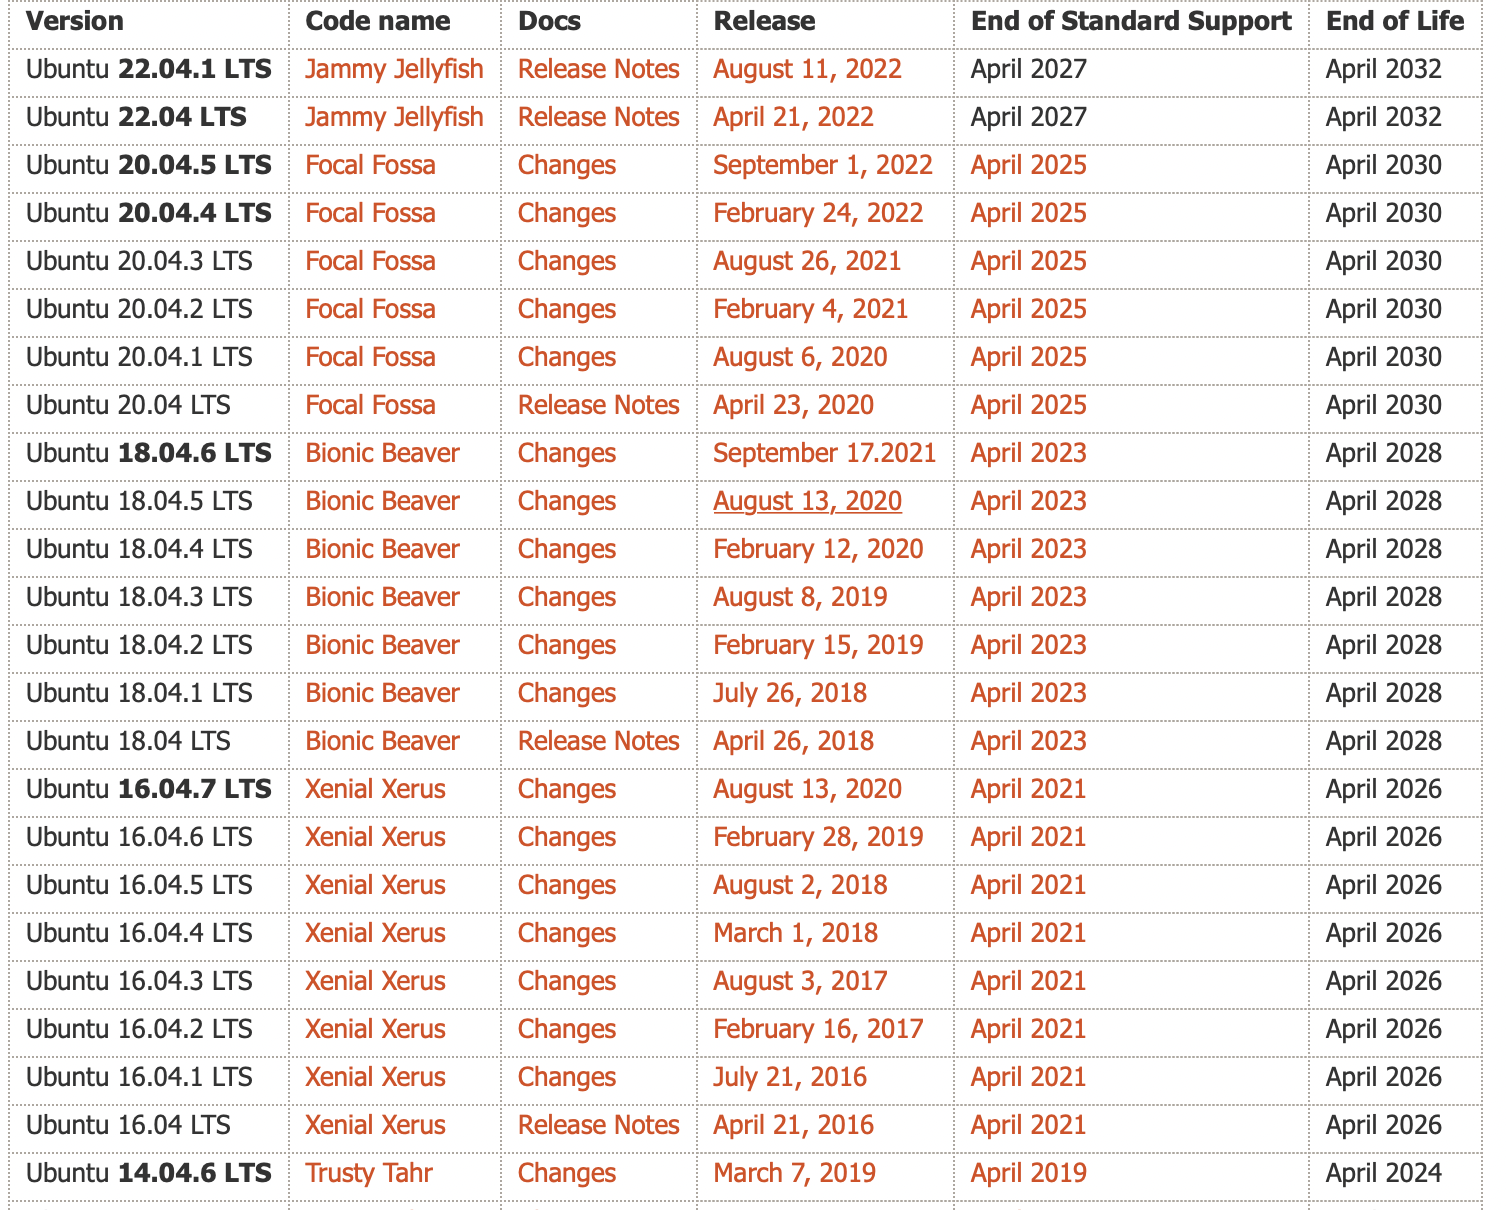
都是动物, 都是两个词,并且两个词的首字母相同,从6.06开始,首字母从D开始递增。
中间版本也有代号 Ubuntu 14.10 (Utopic Unicorn) 以及 Ubuntu 14.04.5 LTS (Trusty Tahr) 官网可以查看
1 | $ lsb_release -a |
常见三板斧
1 | sudo add-apt-repository ppa:dr-akulavich/lighttable |
DEB packages(Debian Binary Package)是Debian及其基于Debian的操作系统(如Ubuntu)中使用的软件包格式。它们是一种存档格式,包含软件的二进制文件、配置文件、依赖关系和其他必要的文件。DEB packages是一种用于软件分发和安装的标准格式。
source.list.不能自动更新。存储库是文件的集合,其中包含有关各种软件、其版本和其他一些详细信息(如校验和)的信息。每个 Ubuntu 版本都有自己的一套官方的四个存储库:
1 | sudo nano /etc/apt/sources.list |
清空缓存
1 | sudo apt clean && sudo apt autoclean |
to read: https://itsfoss.com/ppa-guide/
寻找支持gcc-4.8的apt源,也就是xenial版本的一个源。
1 | vim /etc/apt/sources.list |
Ubuntu 22.04 有对应的 glibc
1 | deb https://mirrors.ustc.edu.cn/ubuntu/ jammy main restricted universe multiverse |
原本的思路是安装gcc-11, 结果发现glibc需要增量安装。需要在node5进行测试。
1 | Unpacking libc6:i386 (2.35-0ubuntu3) over (2.31-0ubuntu9.9) ... |
https://gist.github.com/application2000/73fd6f4bf1be6600a2cf9f56315a2d91
1 | sudo update-alternatives --install /usr/bin/clang clang /usr/bin/clang-6.0 1 --slave /usr/bin/clang++ clang++ /usr/bin/clang++-6.0 |
将某个版本加入gcc候选中,最后的数字是优先级.
运行下面命令切换
1 | sudo update-alternatives --config gcc |
如果只是暂时设置代理,一次性使用:
1 | sudo -E http_proxy="http://proxy.example.com:port" apt-get update |
Or add lines in /etc/apt/apt.conf
1 | Acquire::http::proxy "http://<proxy>:<port>/"; |
This was the reason why you could reach proxy but couldn’t get past it, since there is no username password information. So just put that info into it.
1 | Acquire::http::proxy "http://<username>:<password>@<proxy>:<port>/"; |
save the file and you are done…
TIP: More better add these lines in another file, /etc/apt/apt.conf.d/80proxy. This will ensure that after a version upgrade changes won’t be lost.
MAJ:MIN 主:次 设备号
TYPE:块设备类型,比如disk磁盘,part分区,lvm逻辑卷,rom只读存储
1 | $ lsblk -f # 查看磁盘分区格式,有格式才能挂载成功。 |
使用blkid命令对查询设备上所采用文件系统类型进行查询。blkid主要用来对系统的块设备(包括交换分区)所使用的文件系统类型、LABEL、UUID等信息进行查询。要使用这个命令必须安装e2fsprogs软件包。
直接使用blkid可列出当前系统中所以已挂载文件系统的类型。(或者 check /etc/fstab)
1 | > blkid |
1 | > blkid -o list |
帮助使用者唯一的确定系统中的所有存储设备,不管它们是什么类型的。它可以标识DVD驱动器,USB存储设备以及你系统中的硬盘设备等。
使用原因包括:设备名并非总是不变的
1 | shaojiemike@brainiac1 ~/blockFrequency [08:02:54] |
一种新的安装包管理方式。使用snapcraft将软件打包成snap格式的打包工具集。
1 | +-----------+ +------------+ +------------+ |
snap的每个版本软件会,占用一个/dev/loop
1 | /snap/core18 代表ubuntu 18版本的软件所运行的环境 |
Snap应用运行在以Ubuntu
为核心的容器里,与各个发行版做到了解耦。因此Snap应用的开发者很开心了,
只需保证自己应用在[Ubuntu Core]欢快运行即可,不需要考虑其他发行版的适配。
Snap应用由snapd守护进程管理。snapd每天会去Snap Store查本地Snap应
用有没有可用更新,如果有,就把更新拿下来,应用到当前Snap应用上。自动更新不可关闭,但是可以设置延迟60天。
lxc是Linux Container的简写,它是一种内核虚拟化技术,可以提供轻量级的虚拟化,以便隔离进程和资源;它不需要提供指令解释机制,没有全虚拟化的复杂性,相当于C++中的NameSpace。lxc容器能有效地把操作系统管理的资源划分到不同的组中,并能在不同的组之间平衡有冲突的资源使用需求,因此它可以在单一的主机节点上同时执行多个相互隔离的容器。
lxd是基于lxc构筑的容器管理进程,提供镜像、网络、存储、以及容器等能力。
大家可能有个疑问,为什么不用docker容器呢?docker容器原先也是我的首选,但实际操作过程中发现snap包安装所需要的squashfs文件系统在docker中无法mount,会出现如下错误:
1 | system does not fully support snapd: cannot mount squashfs imag |
/dev/shm下的tmpfs是内存的一半,是一个临时文件系统,驻留在内存中,所以/dev/shm/这个目录不在硬盘上,而是在内存里。因为是在内存里,所以读写非常快,可以提供较高的访问速度。
/sys/fs/cgroup是systemd在代码里自动挂载的。cgroups(Control Groups) 是 linux 内核提供的一种机制,这种机制可以根据需求把一系列系统任务及其子任务整合(或分隔)到按资源划分等级的不同组内,从而为系统资源管理提供一个统一的框架。简单说,cgroups 可以限制、记录任务组所使用的物理资源。
/run/user是每个login的用户所需的一些数据
1 | > ls /run/user -l |
利用tmpfs这个特性可以用来提高服务器性能,把一些对读写性能要求较高,但是数据又可以丢失的这样的数据保存在/dev/shm中,来提高访问速度。
tmpfs用途还是较广的,Linux中可以把一些程序的临时文件放置在tmpfs中,利用tmpfs比硬盘速度快的特点来提升系统性能。比如可以用来放squid程序的缓存文件。
1 | # 临时调整大小,重启后会恢复正常,恢复为内存一半大小。 |
/etc/fstab 是专门用配置挂载硬盘的文件
语法为:
1 | [Device] [Mount Point] [File System Type] [Options] [Dump] [Pass] |
device 有两种表示方式,可以用/dev/xdx 之类的location 或者 硬件的UUID 来表示,硬件的UUID 可以用blkid 来查询
对于uuid
1 | # / was on /dev/sdd2 during curtin installation |
对于id
1 | # /home was on /dev/md0p1 during curtin installation |
1 | > blkid |grep a015c95e |
这里可以看到这7个硬盘的UUID是一样的,说明属于同一个RAID文件系统卷,但是子卷UUID_SUB是不一样的
问题:
/dev/sdd1第四块被拆成了4份auto, vfat( for FAT partition), ntfs or ntfs-3g( for NTFS partition), ext4 or ext3 or ext2 or jfs, udf or iso9660 ( for CD/DVD), swap
当服务器插入一块硬盘,如果我们想要使用该硬盘,需要先使用磁盘分区管理工具进行磁盘分区,然后格式化分区,把分区挂载到目录
上,才可以正式使用该硬盘存储文件。磁盘分区管理工具有很多,本文主要介绍fdisk,gdisk,parted,并进行比较。
fdisk -l和gdisk -l /dev/sda都可以,下面介绍另一种
1 | sudo parted -l |
可以看出上面的普通硬盘和RAID0都是GPT。#显示Partition Table: msdos,则是MBR分区
是传统的分区机制,应用于绝大多数使用BIOS引导的PC设备(苹果使用EFI的方式),很多Server服务器即支持BIOS也支持EFI的引导方式。MBR只支持不超过2TB的硬盘。
MBR分区分为:
解决了MBR的很多缺点;
1. 支持超过2TB的磁盘;
2. 向后兼容MBR;
3. GPT分区只支持64位操作系统;
必须先取消挂载,取消挂载后分区。不然分区结果重启后会消失,文件全没了。
1 | sudo umount /mnt/ #挂载目录 |
创建一个主分区,一个扩展分区,其中扩展分区包含两个逻辑分区。
1 | lsblk |
sdb这块磁盘大小为1G。而且已有分区sdb1
1 | # fdisk /dev/sdb |
1 | [root@node5 ~]# lsblk |
把/dev/sdb5格式化成ext4文件系统[root@node5 ~]# mkfs.ext4 /dev/sdb5
1 | mkdir /sdb5 |
磁盘分区使用mount手动挂载之后,还需要把挂载信息写入/etc/fstab文件中,不然重启之后,需要重新挂载。
1 | mount -a #重新加载内核 |
mdadm是一个用于创建、管理、监控RAID设备的工具,它使用linux中的md驱动。mdadm程序是一个独立的程序,能完成所有软件RAID的管理功能。常见功能如下:
配置文件,默认是”/etc/mdadm.conf”或者是”/etc/mdadm/mdadm.conf”
1 | > cat /etc/mdadm/mdadm.conf |
–metadata=定义组件设备上超级块的类型。对于–create,默认是0.90。
0,0.90 : 限制一个RAID中的设备数为28个,限制组件设备大小为2TB
1,1.0,1.1,1.2 :不同的子版本号标识在不同的地方存储超级块。1.0在设备的结尾,1.1在设备的开头,1.2在设备的4K处。
MAILADDR 使用monitor模式(同时也使–scan选项)时,警报事件发送到的Email地址。
sudo mdadm -Ds > /etc/mdadm/mdadm.conf
把查询出来的 RAID 信息写到 mdadm.conf 中
-s 或 –scan 扫描 RAID 设备;-D 或 –detail 查看 RAID 的详细信息
1 | > cat /proc/mdstat |
猜测命令
1 | mdadm –create /dev/md0 –chunk=512 –metadata=1.2 –level=0 –raid-devices=7 /dev/sda /dev/sdb /dev/sdc /dev/sde /dev/sdf /dev/sdg /dev/sdh |
说明:使用7块创建RAID0,条带大小是512KB。
创建完之后
1 | > lsblk -l |
1 | fdisk /dev/md0 #分区 |
1 | > lsblk -l |
vi /etc/fstab #设置开机自动挂载
增大RAID 的大小涉及按给定顺序执行下列任务:
第一步:
1 | mdadm /dev/md0 --add /dev/sdc1 |
说明:给md0增加热备盘sdc1。运行cat /proc/mdstat等到 RAID 同步并一致,然后再继续下一个分区。
第二步:
RAID 阵列配置将继续使用原始阵列大小,直到您强制其了解新的可用空间。您可以为 RAID 指定大小或使用最大可用空间。
查看大小
1 | sudo mdadm -D /dev/md0 | grep -e "Array Size" -e "Dev Size" |
将RAID大小增加到最大可用大小
1 | sudo mdadm --grow /dev/md0 -z max |
第三步: 不确定
更改 Ext2、Ext3 或 Ext4 文件系统的大小(先查看md0分区大小)
先fdisk删除part1分区,新建同名(同分区标号)的分区,First cylinder起始点相同,通过改变终点为最大值来扩容。
将文件系统大小扩展为名为 /dev/md0 的设备的最大可用大小,请输入
1 | > sudo resize2fs /dev/md0p1 |
如果未指定大小参数,大小将默认为该分区的大小。
Loop设备是一种块设备,但是它并不指向硬盘或者光驱,而是指向一个文件块或者另一种块设备。
回环设备( ‘loopback device’)允许用户以一个普通磁盘文件虚拟一个块设备。设想一个磁盘设备,对它的所有读写操作都将被重定向到读写一个名为 disk-image 的普通文件而非操作实际磁盘或分区的轨道和扇区。(当然,disk-image 必须存在于一个实际的磁盘上,而这个磁盘必须比虚拟的磁盘容量更大。)回环设备允许你这样使用一个普通文件。
将一个Loop设备指向一个文件系统文件,比如iso文件,紧接着就可以通过mount挂载该loop设备到主文件系统的一个目录下了,我们就可以正常访问该镜像中的内容,就像访问一个文件系统一样。
losetup -a列出已使用的。
loop设备映射或者指向一个文件:
1 | # 创建一个文件 |
注意,推进插入的时候把卡扣打开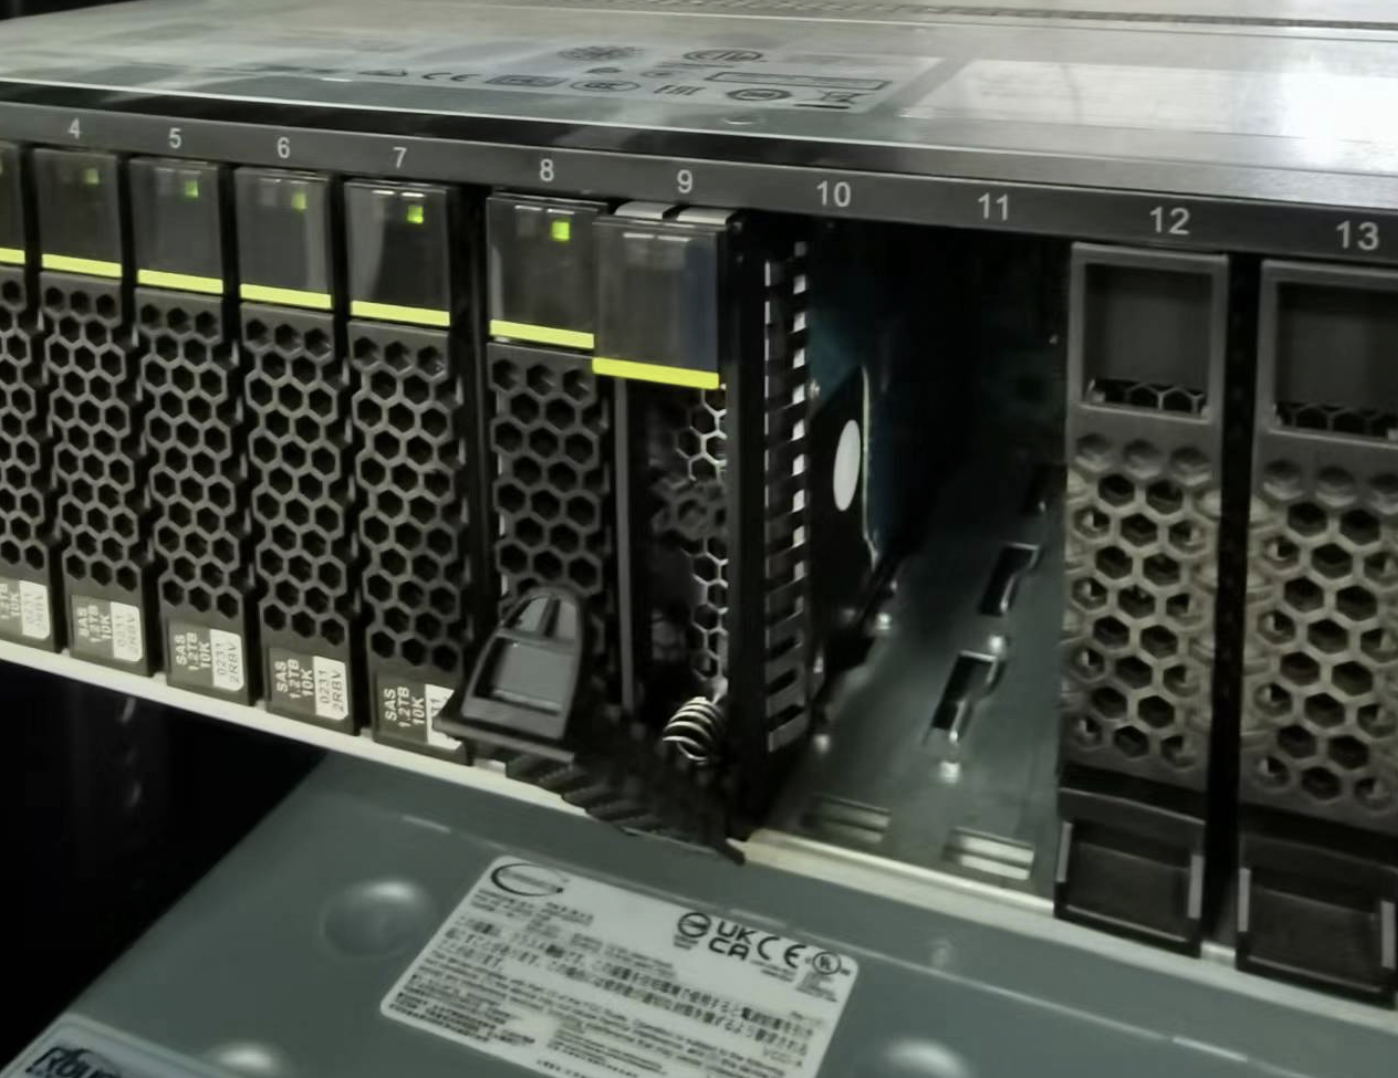
1 | fdisk -l # 看不见新盘 |
还是找不到? 还是8块。
猜测:盘坏了吗?
额外找了其他类型的盘,还有160GB的固态插上。确实是四块坏盘。换了借口也无法识别。
1 | sudo shutdown -h now # 热拔插还是有风险 |
总算整了5块
1 | sdi 8:128 0 931.5G 0 disk |
那sdk为例。
1 | > sudo fdisk /dev/sdk #d 删除分区 |
尝试分区后add分区
1 | > sudo mdadm /dev/md0 --add /dev/sdk1 |
第二种:
1 | mdadm --grow /dev/md0 --level=0 --raid-devices=8 --add /dev/sdk |
理论上这样的,但是要reshape,而且和dev.raid.speed_limit_max速度有关。我不确定会不会丢失资料,所以没尝试。
所以没有扩容
先格式化各个分区
1 | > blkid -o list |
sdi/l/m/k 全部格式化为ext4。blkid -o list不是实时的。挂载后通过df -Th查看
1 | sudo mkfs.ext4 /dev/sdk1 |
修改权限,大家都可以访问(直接777算了
1 | sudo chmod -R ogu+r+w+X /addDisk |
配置开机启动,blkid -o list 获得uuid
1 | /dev/sdk1 ext4 (not mounted) ac862e68-9c6f-424a-b4ec-e44e62f7a330 |
修改/etc/fstab
1 | # /addDisk/DiskNo1 was on /dev/sdi1 during curtin installation |
USB启动的系统,会挂载在COPY-ON-WRITE
1 | ubuntu@ubuntu:/dev$ df -lh |
sudo badblocks -v /dev/sda > badsectors.txtsudo smartctl -H /dev/sda10暂无
https://forum.ubuntu.org.cn/viewtopic.php?t=487421
https://bbs.huaweicloud.com/blogs/197847
https://blog.csdn.net/dangelzjj/article/details/104200396
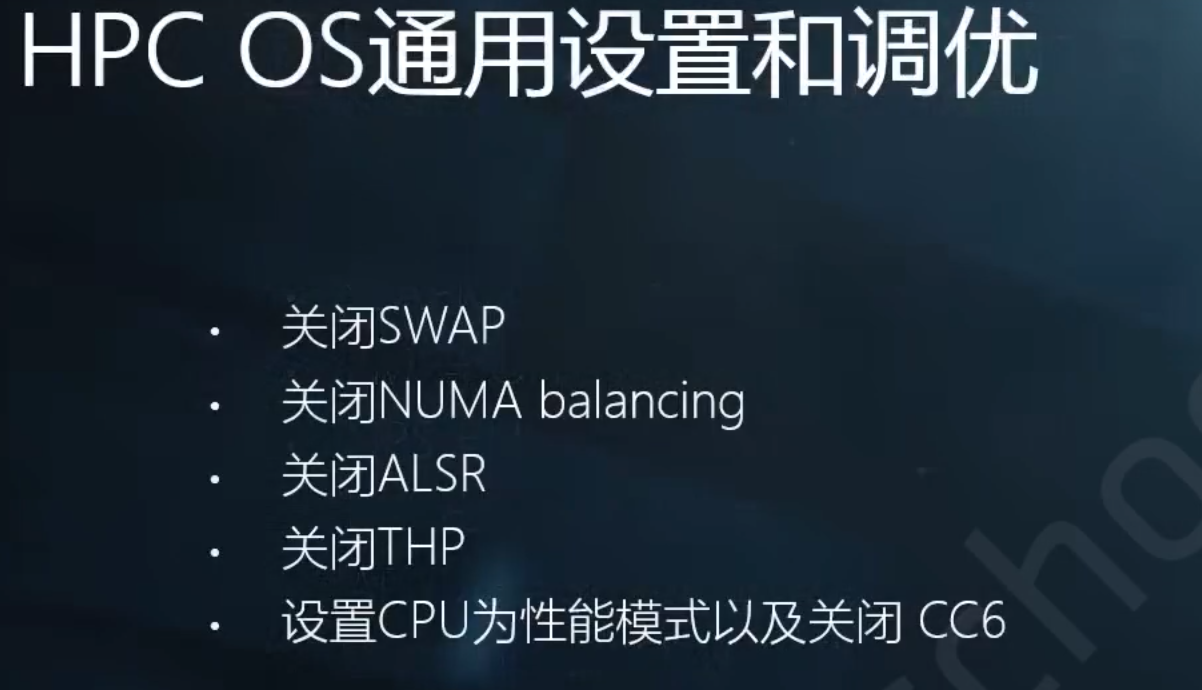
NUMA使用的目的是为了每个进程能使用local内存来实现高性能。但是假如某进程的local内存提前用完了,会导致无法使用其他进程的内存,反而需要SWAP的问题。(一般小例子遇不到)
https://blog.51cto.com/quantfabric/2594323
https://www.cnblogs.com/machangwei-8/p/10402644.html
因为NUMA默认的内存分配策略是优先在进程所在CPU的本地内存中分配,会导致CPU节点之间内存分配不均衡,当某个CPU节点的内存不足时,会导致swap产生,而不是从远程节点分配内存。这就是所谓的swap insanity 现象。
1 | $ numactl --hardware |
1 | # 遇到内存不够时 |
在Linux系统上,可以通过以下常用方法来查看和分析程序的NUMA(非统一内存访问)情况:
1 | numastat:查看进程和每个NUMA节点的内存分配和访问统计。 |
通过综合使用这些工具,可以全面分析程序的NUMA性能,例如内存分布不均,访问模式导致的不均衡等,然后进行针对优化。
numa_alloc_onnode()和numa_free()等API,在指定节点上分配释放内存。暂无
暂无
由于snode0有sudo
1 | source /opt/intel/oneapi/setvars.sh |
sudo后图形化界面 MobaXterm打不开的原因参考这个
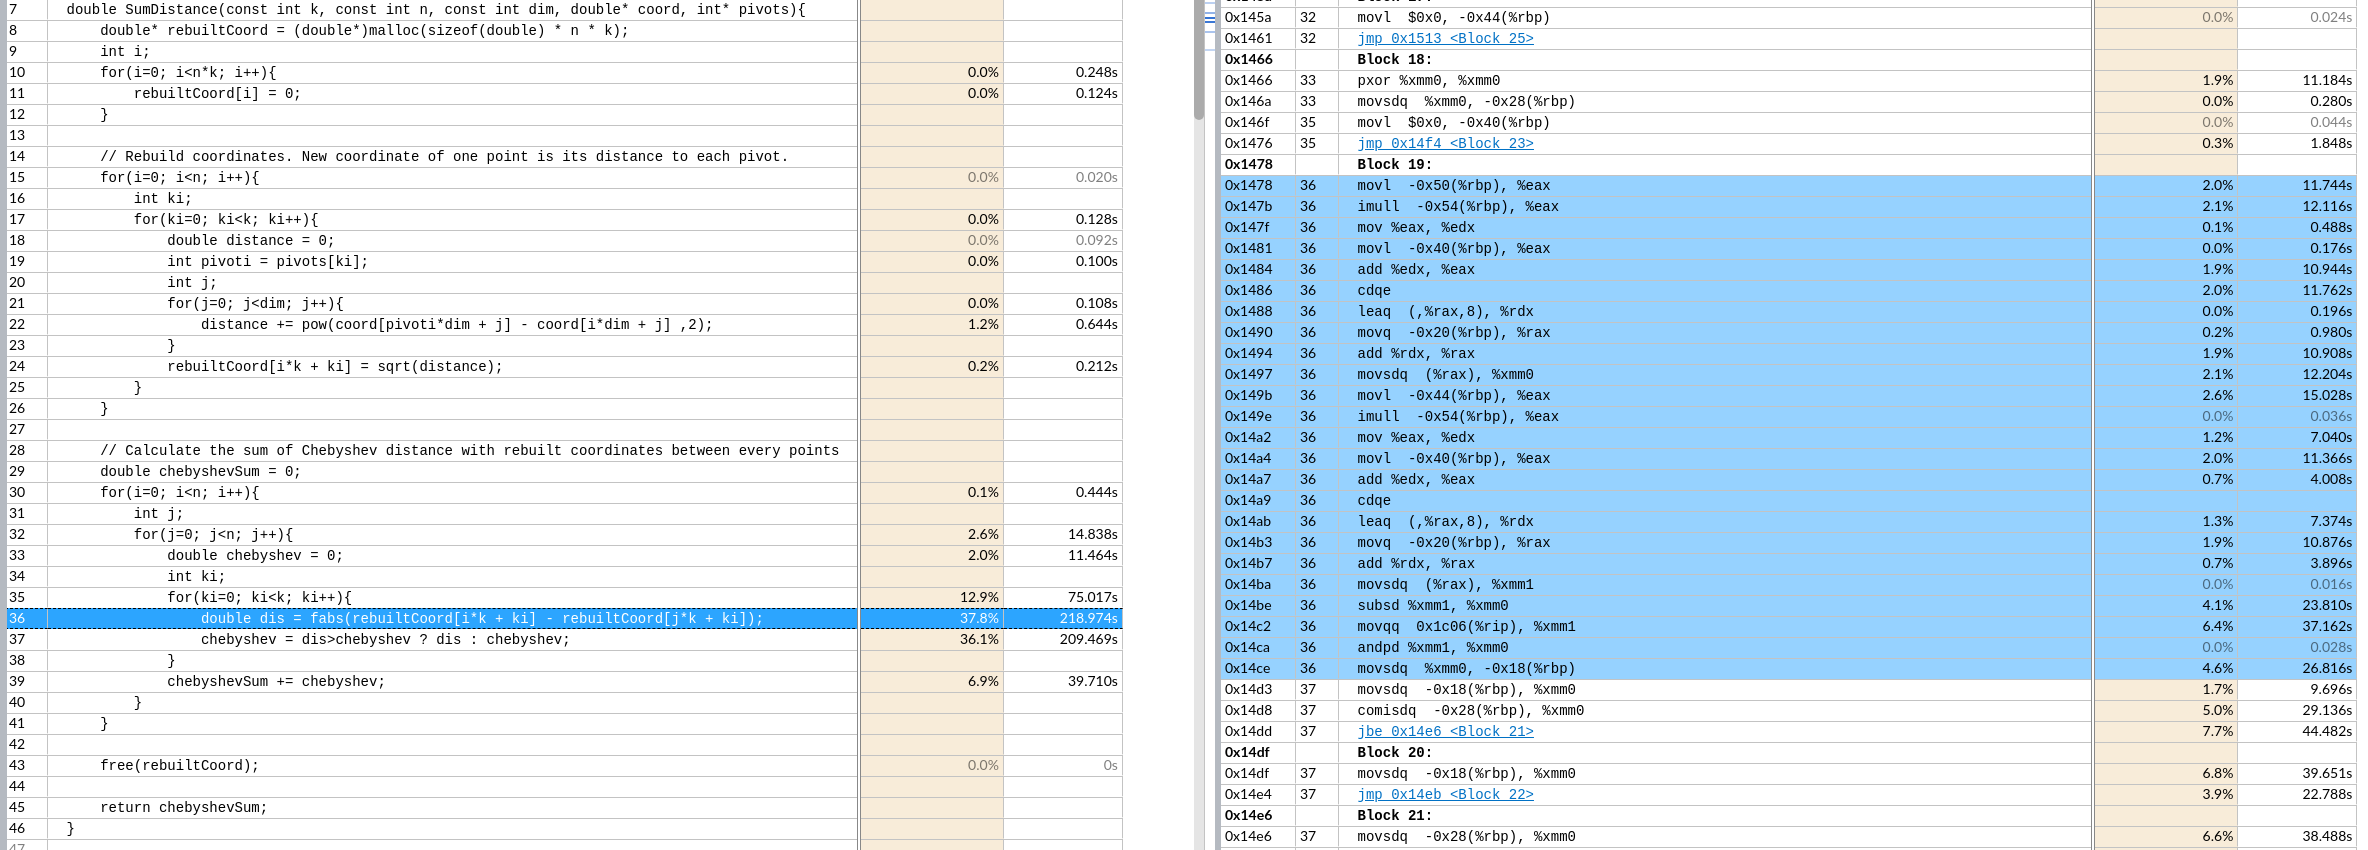
以IPCC2022 初赛 支撑点计算的baseline为例
1 | Effective Logical Core Utilization: 3.8% (2.436 out of 64) |
CPU利用率主要是指计算有效占比。为100%意味着所有逻辑CPU都是由应用程序的计算占用。
微架构使用指标是一个关键指标,可以帮助评估(以%为单位)你的代码在当前微架构上运行的效率。
微架构的使用可能会受到
1 | Microarchitecture Usage: 37.7% of Pipeline Slots |
针对Back-End Bound: 23.8%的建议如下:
A significant portion of pipeline slots are remaining empty.
(??? 他是指有23.8% empty还是被使用了呢)
When operations take too long in the back-end, they introduce bubbles in the pipeline that ultimately cause fewer pipeline slots containing useful work to be retired per cycle than the machine is capable to support.
This opportunity cost results in slower execution.
针对Bad Speculation: 21.5%的建议如下:
A significant proportion of pipeline slots containing 21.5% useful work are being cancelled.
This can be caused by mispredicting branches or by machine clears. Note that this metric value may be highlighted due to Branch Resteers issue.
Retiring metric represents a Pipeline Slots fraction utilized by useful work, meaning the issued uOps that eventually get retired.
Retiring metric 表示有用工作所使用的Pipeline slot流水线管道的比例,所有发射的uOps最终都会retired。
Ideally, all Pipeline Slots would be attributed to the Retiring category.
理想情况下,所有的管道槽都应该归于退休类别。
Retiring of 100% would indicate the maximum possible number of uOps retired per cycle has been achieved. 100%的退役表明每个周期内退役的uop数量达到了可能的最大值。
Maximizing Retiring typically increases the Instruction-Per-Cycle metric.
最大化Retiring通常会增加IPC。
Note that a high Retiring value does not necessary mean no more room for performance improvement.
For example, Microcode assists are categorized under Retiring. They hurt performance and can often be avoided.
Microcode assists根据Intel的解释是
当遇到特殊的计算(比如处理非常小的浮点值(所谓的逆法线)时),浮点单元并没有被设置为本机执行这些操作。为此需要在指令流中插入可能有数百个指令长的小程序,对性能会造成很大的影响。
Front-End Bound metric represents a slots fraction where the processor’s Front-End undersupplies its Back-End. 该指标表示前端产生的指令是否足以支持后端处理。
Front-End denotes the first part of the processor core responsible for fetching operations that are executed later on by the Back-End part. 前端将指令分解成uops供后端处理。
Within the Front-End, a branch predictor predicts the next address to fetch, cache-lines are fetched from the memory subsystem, parsed into instructions, and lastly decoded into micro-ops (uOps). 在前端中,分支预测器预测下一个要获取的地址,缓存行从内存子系统中获取,解析为指令,最后解码为微操作(uOps)。
Front-End Bound metric denotes unutilized issue-slots when there is no Back-End stall (bubbles where Front-End delivered no uOps while Back-End could have accepted them). For example, stalls due to instruction-cache misses would be categorized as Front-End Bound
Front-End Bound指标表示当后端没有停顿时未使用的发射槽(bubbles: 前端没有交付uOps,而发射给后端的)。例如,由于指令缓存未命中而导致的暂停将被归类为Front-End Bound
metric represents a Pipeline Slots fraction where no uOps are being delivered due to a lack of required resources for accepting new uOps in the Back-End. 该指标表示后端uops是否出现了因为硬件资源紧张而无法处理的问题。
Back-End is the portion of the processor core where an out-of-order scheduler dispatches ready uOps into their respective execution units, and, once completed, these uOps get retired according to the program order. 后端的乱序执行,顺序Reire模型。
For example, stalls due to data-cache misses or stalls due to the divider unit(除法器?) being overloaded are both categorized as Back-End Bound. Back-End Bound is further divided into two main categories: Memory Bound and Core Bound.
This metric shows how memory subsystem issues affect the performance. Memory Bound measures a fraction of slots where pipeline could be stalled due to demand load or store instructions. This accounts mainly for incomplete in-flight memory demand loads that coincide with execution starvation in addition to less common cases where stores could imply back-pressure on the pipeline.
This metric represents how much Core non-memory issues were of a bottleneck. 表明核心的非内存原因成为了瓶颈
Hence it may indicate
represents a Pipeline Slots fraction wasted due to incorrect speculations.
This includes slots used to issue uOps that do not eventually get retired and slots for which the issue-pipeline was blocked due to recovery from an earlier incorrect speculation.
For example, wasted work due to mispredicted branches is categorized as a Bad Speculation category. Incorrect data speculation followed by Memory Ordering Nukes is another example.
这里的Nukes, 猜测是数据预取预测错误,带来的访存影响像核爆一样大吧.
1 | Memory Bound: 11.9% of Pipeline Slots |
This metric shows how memory subsystem issues affect the performance. Memory Bound measures a fraction of slots where pipeline could be stalled due to demand load or store instructions. 该项表明了有多少流水线的slots因为load或者store指令的需求而被迫等待
This accounts mainly for incomplete in-flight memory demand loads that coincide with execution starvation
这是指不连续访存吗?
in addition to less common cases where stores could imply back-pressure on the pipeline.
This metric shows how often machine was stalled without missing the L1 data cache.
在不发生L1 miss的情况下,指令stall的频率。(因为其他原因导致stall?)
The L1 cache typically has the shortest latency. However, in certain cases like loads blocked on older stores, a load might suffer a high latency even though it is being satisfied by the L1. 假设load了一个刚store的值,load指令也会遇到很大的延迟。
This metric shows how often machine was stalled on L2 cache. Avoiding cache misses (L1 misses/L2 hits) will improve the latency and increase performance.
This metric shows how often CPU was stalled on L3 cache, or contended with a sibling Core(与兄弟姐妹核竞争). Avoiding cache misses (L2 misses/L3 hits) improves the latency and increases performance.
This metric shows how often CPU was stalled on the main memory (DRAM). Caching typically improves the latency and increases performance.
This metric represents percentage of elapsed time the system spent with high DRAM bandwidth utilization. Since this metric relies on the accurate peak system DRAM bandwidth measurement, explore the Bandwidth Utilization Histogram and make sure the Low/Medium/High utilization thresholds are correct for your system. You can manually adjust them, if required.
This metric shows how often CPU was stalled on store operations. Even though memory store accesses do not typically stall out-of-order CPUs; there are few cases where stores can lead to actual stalls.
In NUMA (non-uniform memory architecture) machines, memory requests missing LLC may be serviced either by local or remote DRAM. Memory requests to remote DRAM incur much greater latencies than those to local DRAM. It is recommended to keep as much frequently accessed data local as possible. This metric shows percent of remote accesses, the lower the better.
可以用之前的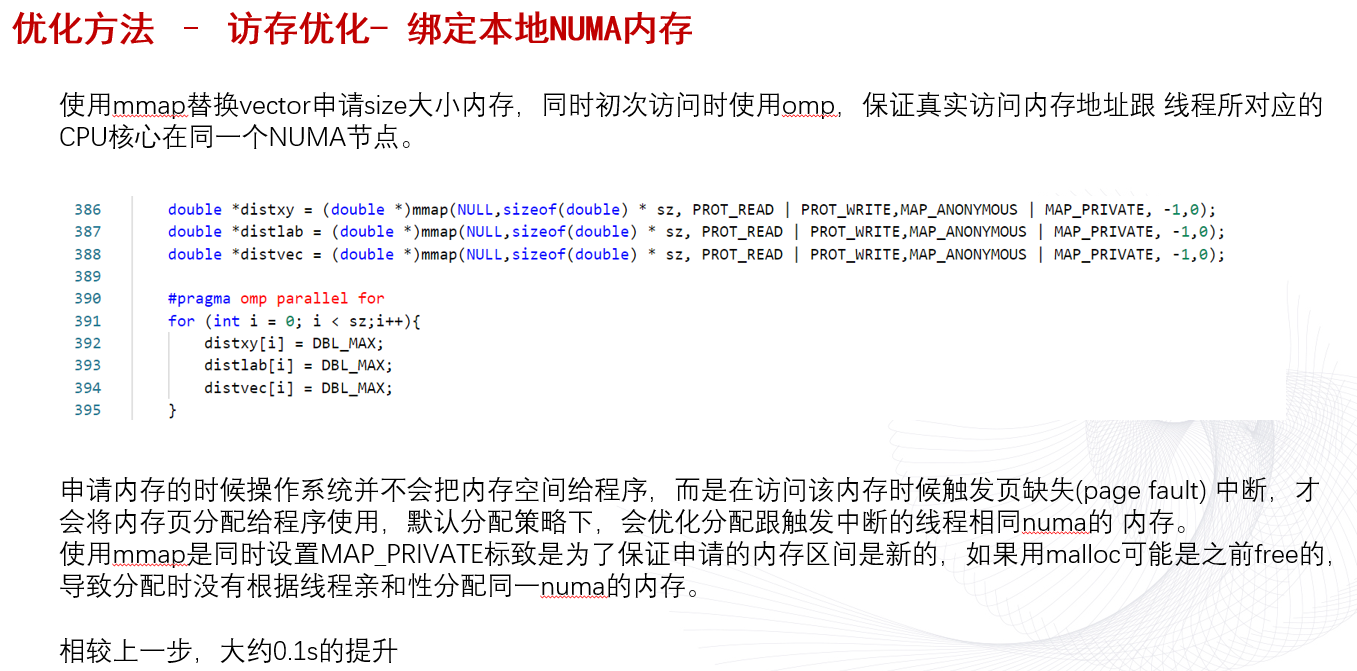
This metric represents the percentage of packed (vectorized) floating point operations. 0% means that the code is fully scalar. The metric does not take into account the actual vector length that was used by the code for vector instructions. So if the code is fully vectorized and uses a legacy instruction set that loaded only half a vector length, the Vectorization metric shows 100%.
1 | Vectorization: 23.7% of Packed FP Operations |
针对Vectorization: 23.7%的建议
A significant fraction of floating point arithmetic instructions are scalar. Use Intel Advisor to see possible reasons why the code was not vectorized.
The metric represents the percentage of single precision floating point operations from all operations executed by the applications. Use the metric for rough estimation of a SP FLOP fraction. If FMA vector instructions are used the metric may overcount.
The metric represents the percentage of x87 floating point operations from all operations executed by the applications. Use the metric for rough estimation of an x87 fraction. If FMA vector instructions are used the metric may overcount.
X87是X86体系结构指令集的浮点相关子集。 它起源于8086指令的扩展,以可选的浮点协处理器的形式与相应的x86 cpus配合使用。 这些微芯片的名称在“ 87”中结尾。
This metric represents the ratio between arithmetic floating point instructions and memory write instructions. A value less than 0.5 indicates unaligned data access for vector operations, which can negatively impact the performance of vector instruction execution.
小于0.5的值表示向量操作的未对齐数据访问,这可能会对矢量指令执行的性能产生负面影响。
User-Mode Sampling只能采集单核的数据,来分析算法的优化。
Hardware Event-Based Sampling硬件时间采集能采集全部核心,但是要少于几秒钟?
这个硬件采集慢,而且到一半报错了,发生什么事了?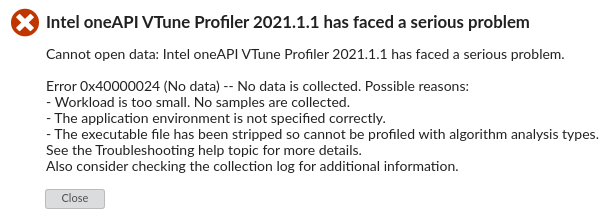

网上说是root权限的原因,但是我是用root运行的
反而用普通用户能正常跑Hardware Event-Based Sampling和微架构分析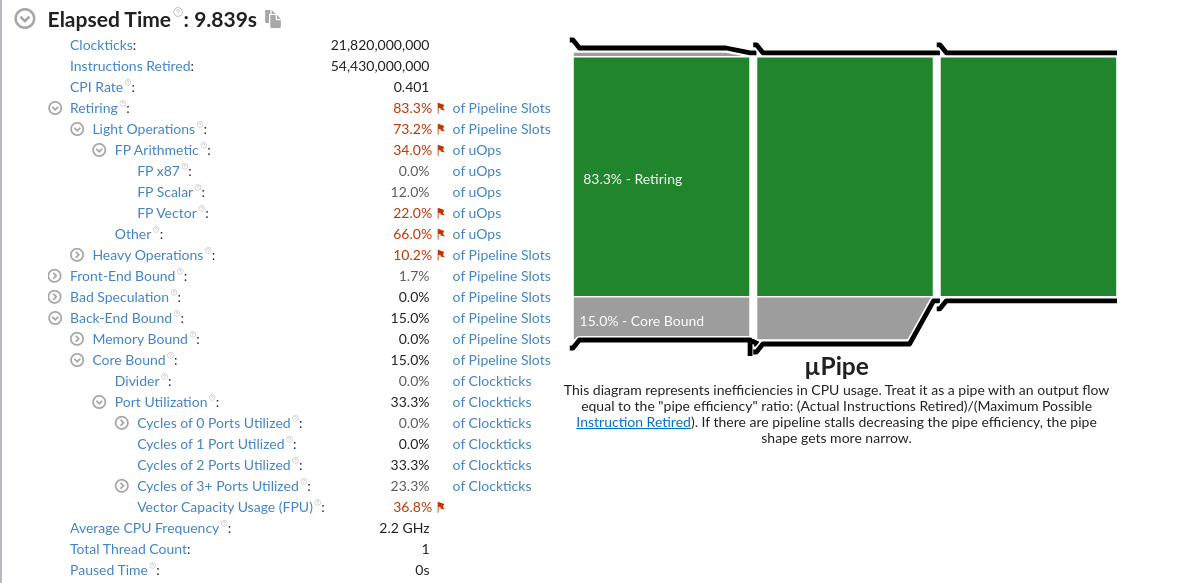
手动向量化该区域。
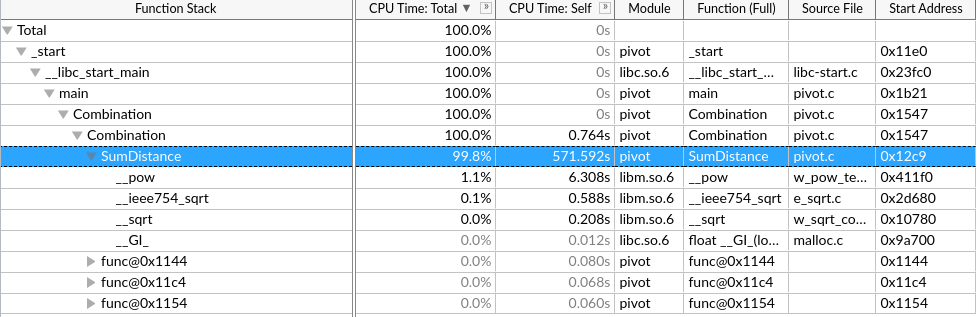
核心时间是 $k*n^2$ 次绝对值和,取最大值
优化思路:
手动向量化(假设一次处理p个)
第一个n层取出 k个 rebuilt[i*k+ki] 重复读取到向量寄存器里,
第二个n层取出k 个 连续的p个,到向量寄存器里。最后不足补0特殊处理,但是一般n都是4的倍数,可能可以不处理。8就要处理了。
做向量fabs的结果缓存在k个向量寄存器里。
再对这个k个向量寄存器做横向的向量最大值操作到一个向量寄存器。不足的补0(取最大值不影响)
最后这一个向量寄存器做寄存器内求和,再加到 chebyshevSum 里.
这样就实现了p个元素的向量操作。这样一趟共需要3*k个向量寄存器。
__builtin_prefetch()手动循环展开形成计算访存流水
分块
1 | $ lscpu |
1 | $ gcc --version |
由于O3和并行会导致热点代码不可读
在可迭代优化的例子下,根据vtune最大化单核性能。
很明显不是计算密集的应用,怎么形成流水最大化带宽利用,划分重复利用元素提高Cache命中率是重点(向量化对计算加速明显)
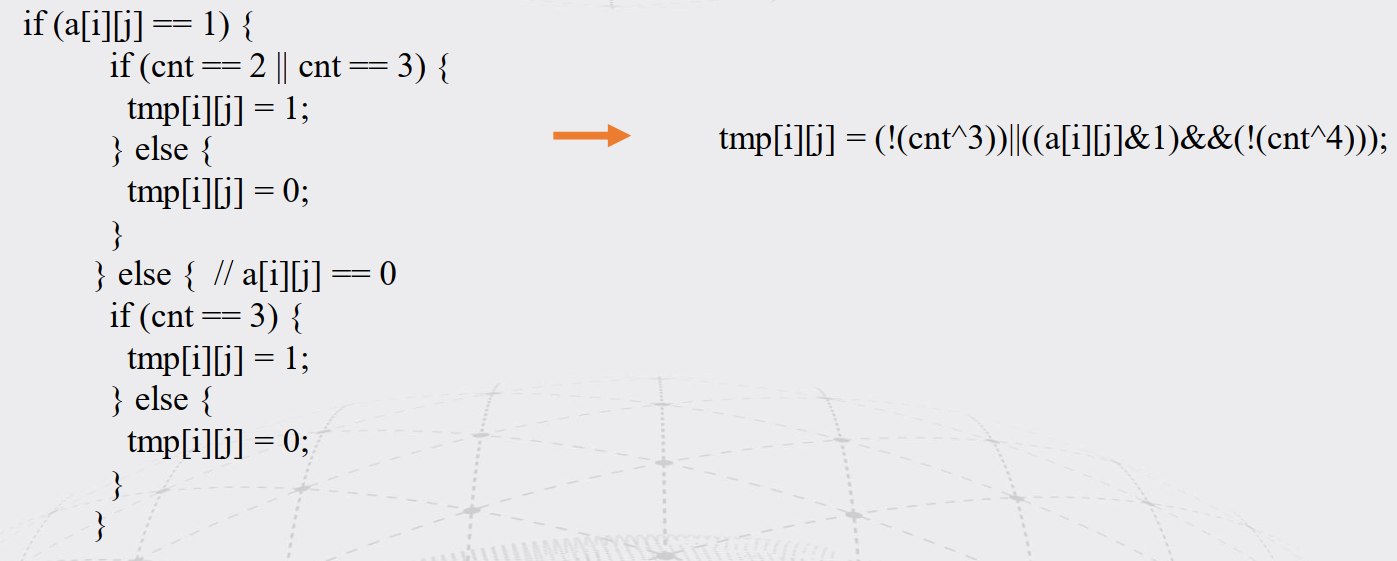
tmp[i][j] = (!(cnt^3))||((a[i][j]&1)&&(!(cnt^4)));暂无
暂无
http://www.cs.iit.edu/%7Esun/cs546.html#materials
https://annals-csis.org/Volume_8/pliks/498.pdf
Superlinear Speedup in HPC Systems: why and when?
迭代进行 :分析程序最大热点(perf,vtune工具)->优化该热点—>分析程序最大热点->……
自顶向下分析优化程序热点的思路
基本了解物理数学背景公式
阅读代码,明白实现
建议串行直接用vtune判断算法热点和时间
寻找合适的大例子
1 |
|
1 | ./SLIC_0805_3 |tee 3.log && ./SLIC_0805_3 |tee 3.log && ./SLIC_0805_3 |tee 3.log |
7. 每次优化基给予正确性的评价,并对负优化进行解释。
utils.cpp和 utils.h写
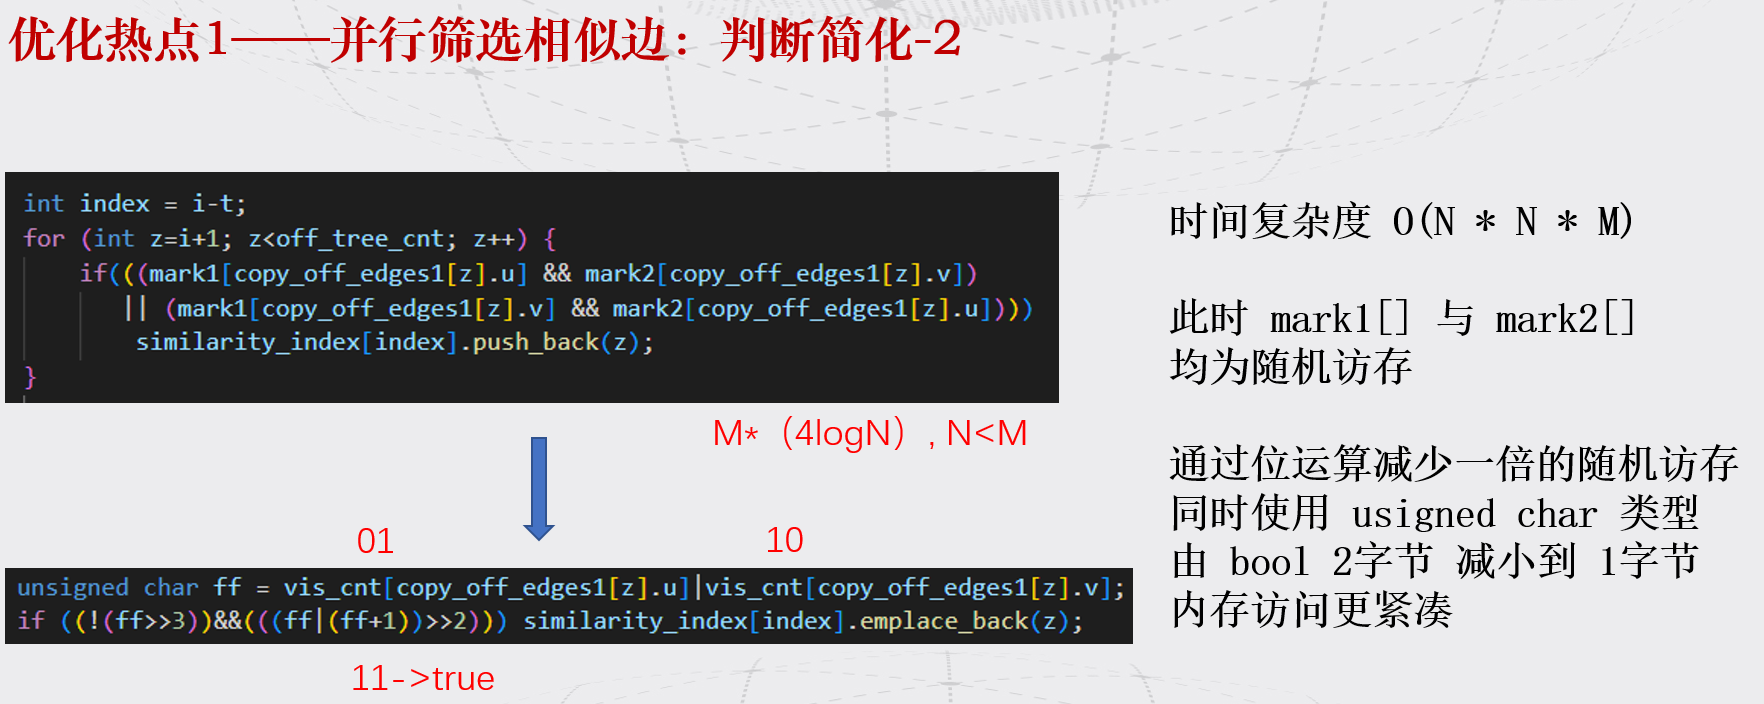
|A 删A:&(~A)判断:&A!=0tmp[i][j] = (!(cnt^3))||((a[i][j]&1)&&(!(cnt^4)));
J5GBR.png)
1 | MiB = Mebibyte = 1024 KB, |

Software optimization resources :https://www.agner.org/optimize/
https://www.bilibili.com/video/BV19q4y197uX?spm_id_from=333.999.0.0
https://www.bilibili.com/video/BV1vU4y1u7nL?spm_id_from=333.999.0.0
2 sockets cpu latency : 50/60
core memory bandwidth :20GB/s
0F1X@WZW~J9U.png)
陈子忠 教授( 美国加州大学河滨分校 ) 230616报告
太糊了
因为参加2021 IPCC,观看B站视频,学到很多特地总结一下