### critical vs atomic The fastest way is neither critical nor atomic. Approximately, addition with critical section is 200 times more expensive than simple addition, atomic addition is 25 times more expensive then simple addition.(**maybe no so much expensive**, the atomic operation will have a few cycle overhead (synchronizing a cache line) on the cost of roughly a cycle. A critical section incurs **the cost of a lock**.)
The fastest option (not always applicable) is to give each thread its own counter and make reduce operation when you need total sum.
### critical vs ordered omp critical is for mutual exclusion(互斥), omp ordered refers to a specific loop and ensures that the region **executes sequentually in the order of loop iterations**. Therefore omp ordered is stronger than omp critical, but also only makes sense within a loop.
omp ordered has some other clauses, such as simd to enforce the use of a single SIMD lane only. You can also specify dependencies manually with the depend clause.
Note: Both omp critical and omp ordered regions have an implicit memory flush at the entry and the exit.
### ordered example
vector<int> v;
#pragma omp parallel for ordered schedule(dynamic, anyChunkSizeGreaterThan1) for (int i = 0; i < n; ++i){ … … … #pragma omp ordered v.push_back(i); }
1 2 3 4 5 6
``` tid List of Timeline iterations 0 0,1,2 ==o==o==o 1 3,4,5 ==.......o==o==o 2 6,7,8 ==..............o==o==o
= shows that the thread is executing code in parallel. o is when the thread is executing the ordered region. . is the thread being idle, waiting for its turn to execute the ordered region.
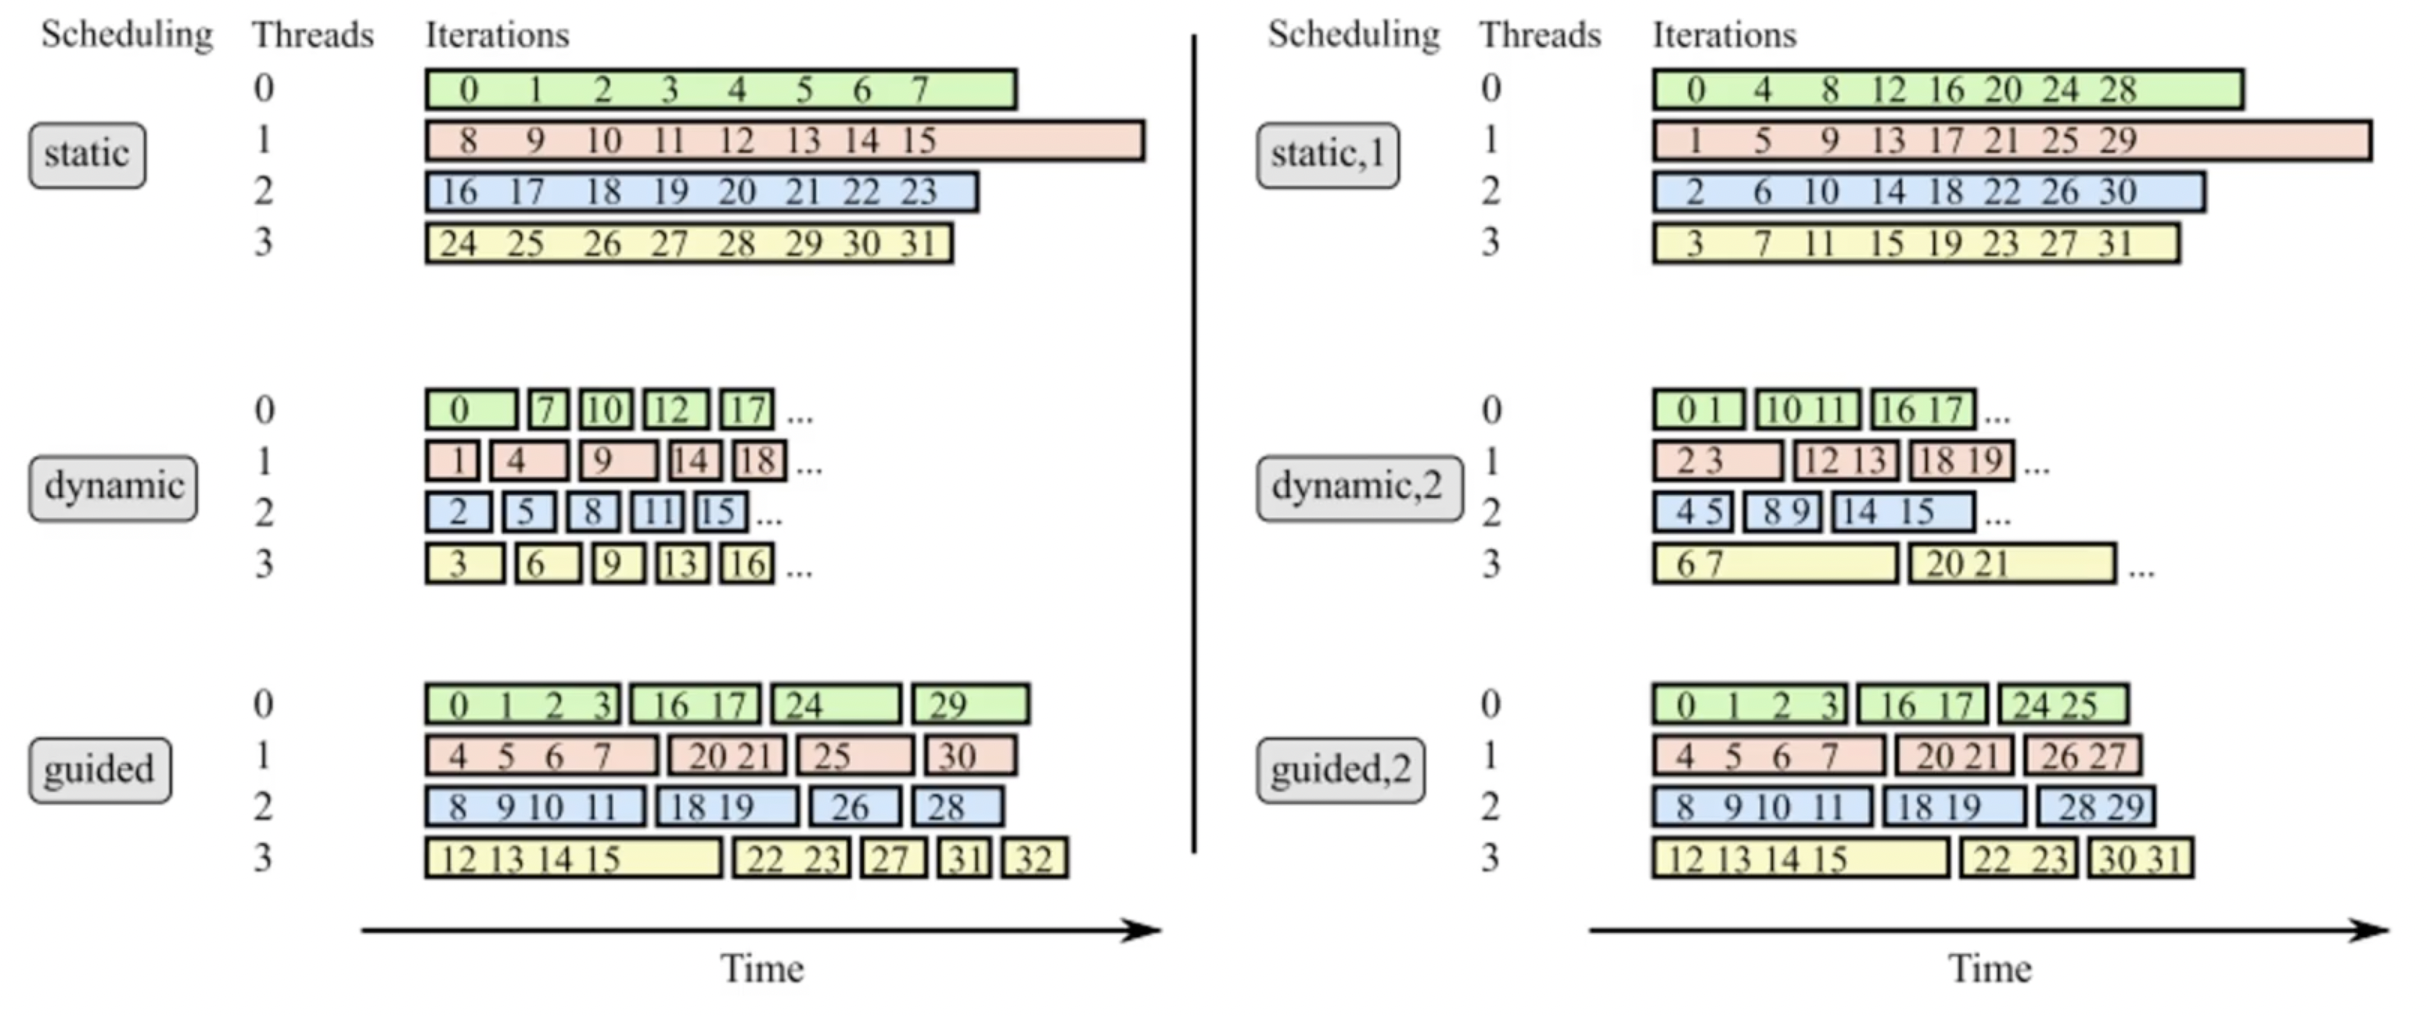
With schedule(static,1) the following would happen:
1 2 3 4 5
tid List of Timeline iterations 0 0,3,6 ==o==o==o 1 1,4,7 ==.o==o==o 2 2,5,8 ==..o==o==o
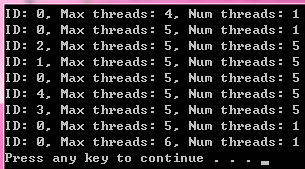
private variables are not initialised, i.e. they start with random values like any other local automatic variable
firstprivate initial the value as the before value.
lastprivate save the value to the after region. 这个last的意思不是实际最后运行的一个线程,而是调度发射队列的最后一个线程。从另一个角度上说,如果你保存的值来自随机一个线程,这也是没有意义的。 firstprivate and lastprivate are just special cases of private
1 2 3 4 5 6 7
#pragma omp parallel { #pragma omp for lastprivate(i) for (i=0; i<n-1; i++) a[i] = b[i] + b[i+1]; } a[i]=b[i];
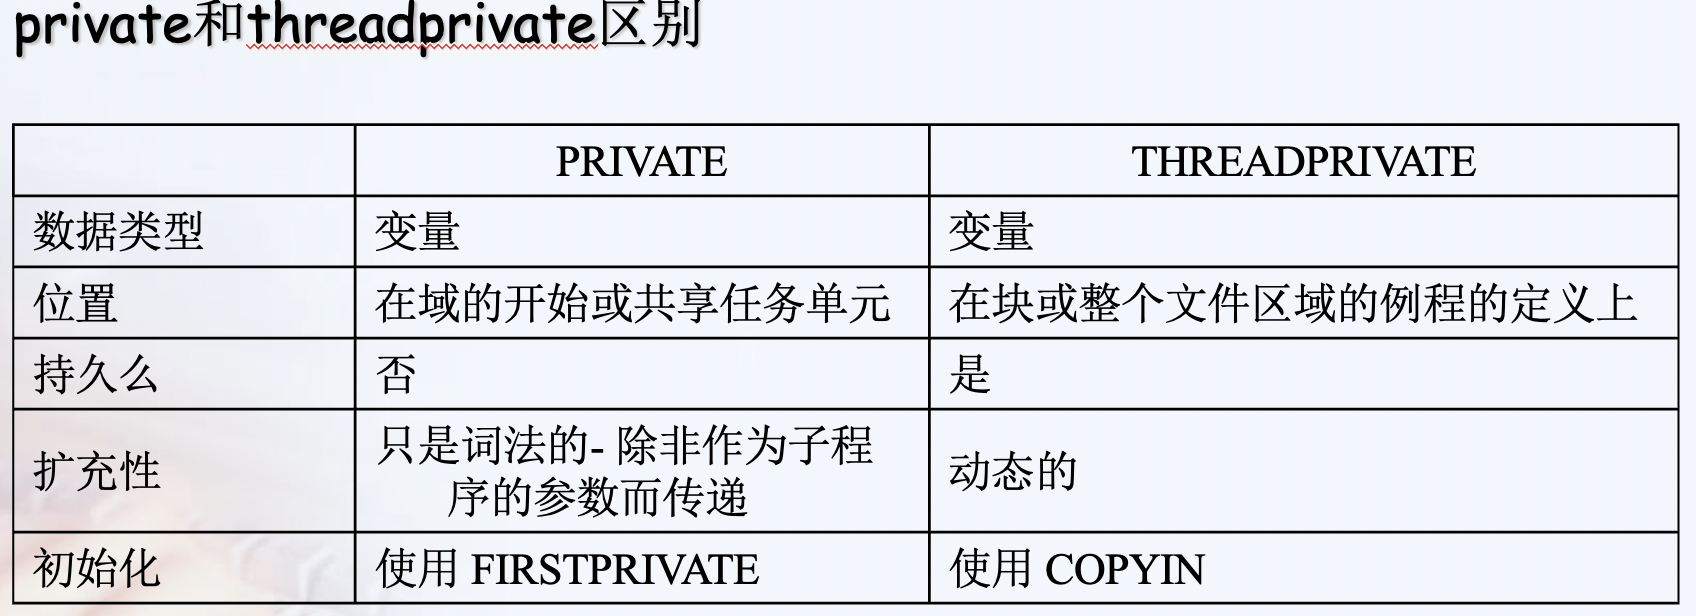
private vs threadprivate
A private variable is local to a region and will most of the time be placed on the stack. The lifetime of the variable’s privacy is the duration defined of the data scoping clause. Every thread (including the master thread) makes a private copy of the original variable (the new variable is no longer storage-associated with the original variable).
A threadprivate variable on the other hand will be most likely placed in the heap or in the thread local storage (that can be seen as a global memory local to a thread). A threadprivate variable persist across regions (depending on some restrictions). The master thread uses the original variable, all other threads make a private copy of the original variable (the master variable is still storage-associated with the original variable).
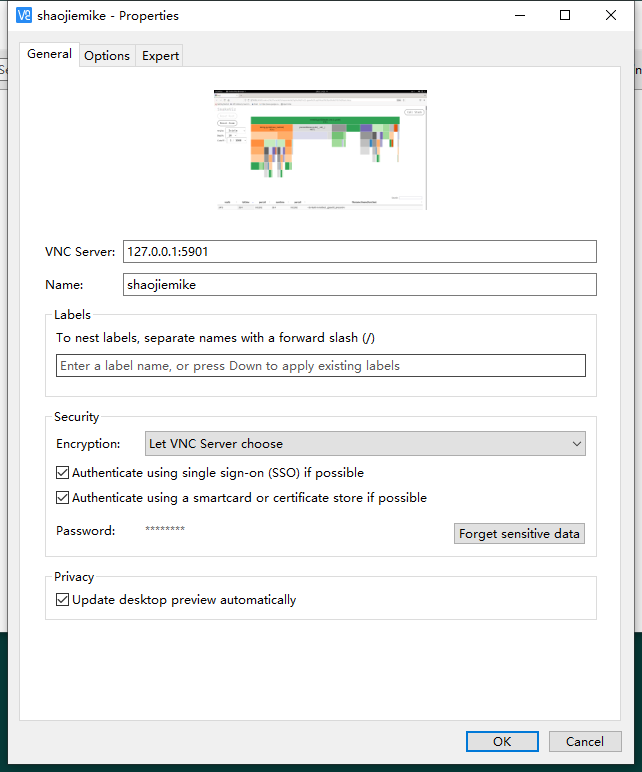
# shaojiemike @ node5 in ~ [11:26:56] $ vncserver -list
TigerVNC server sessions:
X DISPLAY # RFB PORT # PROCESS ID :1 5901 148718 (stale)
# shaojiemike @ node5 in ~ [11:29:39] $ vncpasswd Password:
# shaojiemike @ node5 in ~ [11:34:08] $ vncserver -kill :1 Killing Xtigervnc process ID 148718... which was already dead Cleaning stale pidfile '/home/shaojiemike/.vnc/node5:1.pid'!
# shaojiemike @ node5 in ~ [11:36:15] $ vncserver
New 'node5:2 (shaojiemike)' desktop at :2 on machine node5
Starting applications specified in /etc/X11/Xvnc-session Log file is /home/shaojiemike/.vnc/node5:2.log
Use xtigervncviewer -SecurityTypes VncAuth -passwd /home/shaojiemike/.vnc/passwd :2 to connect to the VNC server.
BIC (bit clear) EON (Exclusive OR) ORR (OR operations on the values in Rn and Operand2)
InstRW的定义
1 2 3 4 5 6 7 8 9 10 11
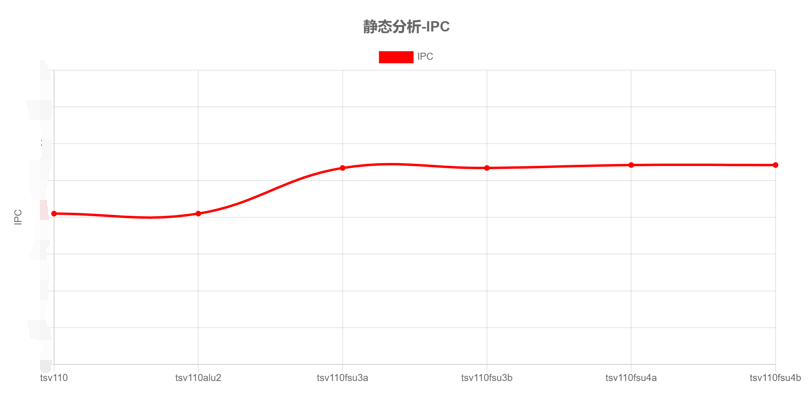
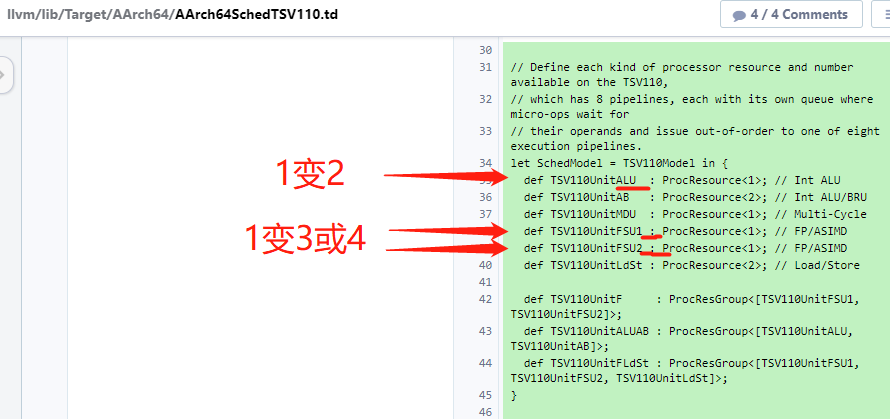
// Map a set of opcodes to a list of SchedReadWrite types. This allows // the subtarget to easily override specific operations. // // SchedModel ties this opcode mapping to a processor. classInstRW<list<SchedReadWrite> rw, dag instrlist> { list<SchedReadWrite> OperandReadWrites = rw; dag Instrs = instrlist; SchedMachineModel SchedModel = ?; // Allow a subtarget to mark some instructions as unsupported. bit Unsupported = false; }
TSV110Wr_2cyc_1MDU的定义
1 2 3 4 5 6 7 8 9
def TSV110Wr_2cyc_1MDU : SchedWriteRes<[TSV110UnitMDU]> { let Latency = 2; }
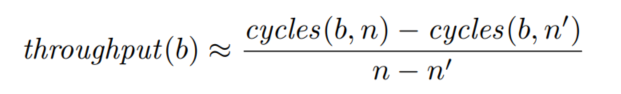
A key technical challenge with collecting a large basic block dataset is that there is no existing approach to profile an arbitrary basic block that has been removed from its program context.
(没懂?那为什么要removed from its program context) 因为要把常用的应用拆成小例子来评判,这些模型的准确性。
unroll factor的选取。It uses 100 and 200 as the unroll factors for basic blocks smaller than 100 bytes; 50 and 100 for basic blocks between 100 bytes and 200 bytes; and finally 16 and 32 for basic blocks larger than 200 bytes
有将多个虚拟页面映射到几个物理页面的API。map multiple virtual pages to a few physical pages
without incurring a performance penalty due to unnecessary cache invalidation. We therefore require that the target processor has a **physically tagged data cache(VIPT)**???
we additionally require that the page size is small enough so the indexing bits are not affected by address translation.
detecting cache misses,
and detecting or disabling floating-point underflow.
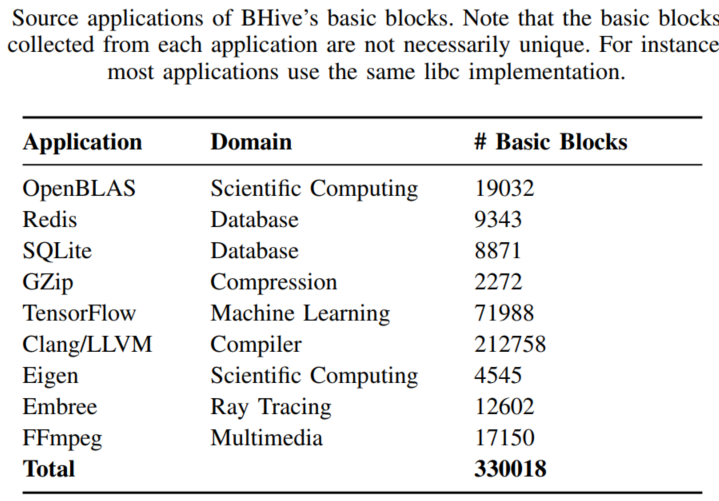
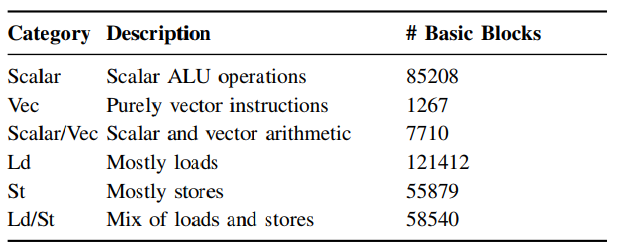
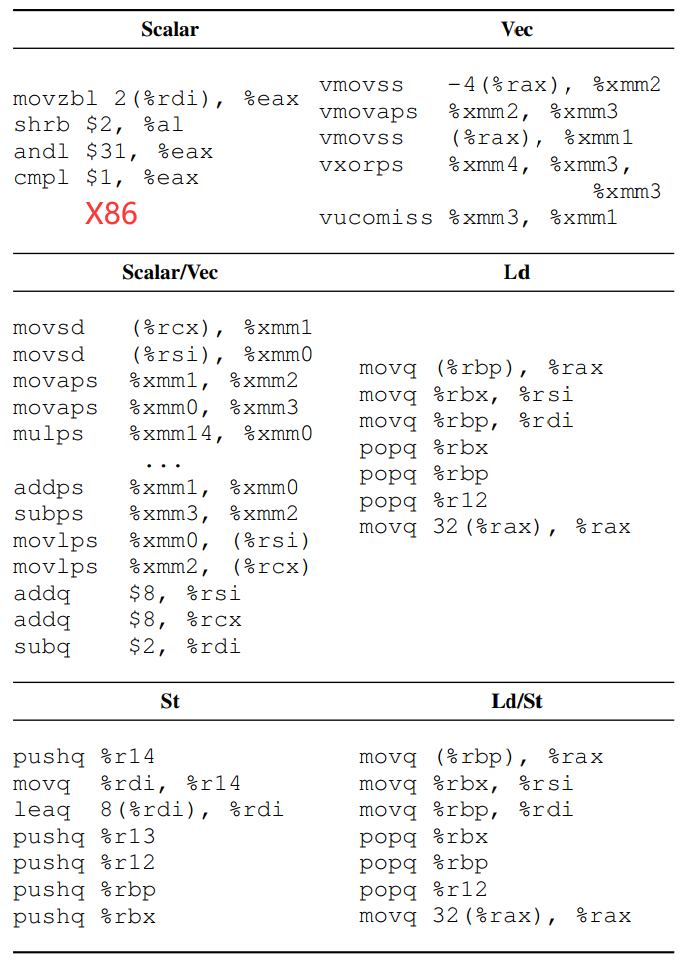
IV. BASIC BLOCK DATASET
应用的选择
尽可能还原现实生活的各个方面,
而且是用户的典型用法。
Clang/LLVM (compiler), Redis (inmemory database), SQLite (database), and Gzip 是用高级语言C或者C++编写的,算法和数据结构有复杂的设计。
OpenSSL (cryptography), OpenBLAS , Eigen (scientific computing),TensorFlow (machine learning) 代表的是核心循环是手动汇编优化过的高性能库。
其中Embree是 用Intel ispc (a data-parallel language)编写的。
We compiled all applications with the highest optimization settings defined by their build systems. 如果可以用上了AVX2。
使用DynamoRIO动态分析来提炼基本块。可以实现在运行时记录每个运行的基本块。我们采用动态分析,而不是静态反汇编。因为静态反汇编无法区别padding bytes from instructions。???
应用的例子除了FFmpeg and Gzip都是选择的官方的benchmark。 Eigen 采用的是 two sparse linear algebra workloads: sparse matrix-matrix multiplication (SpMM) and sparse matrix-vector multiplication (SpMV).
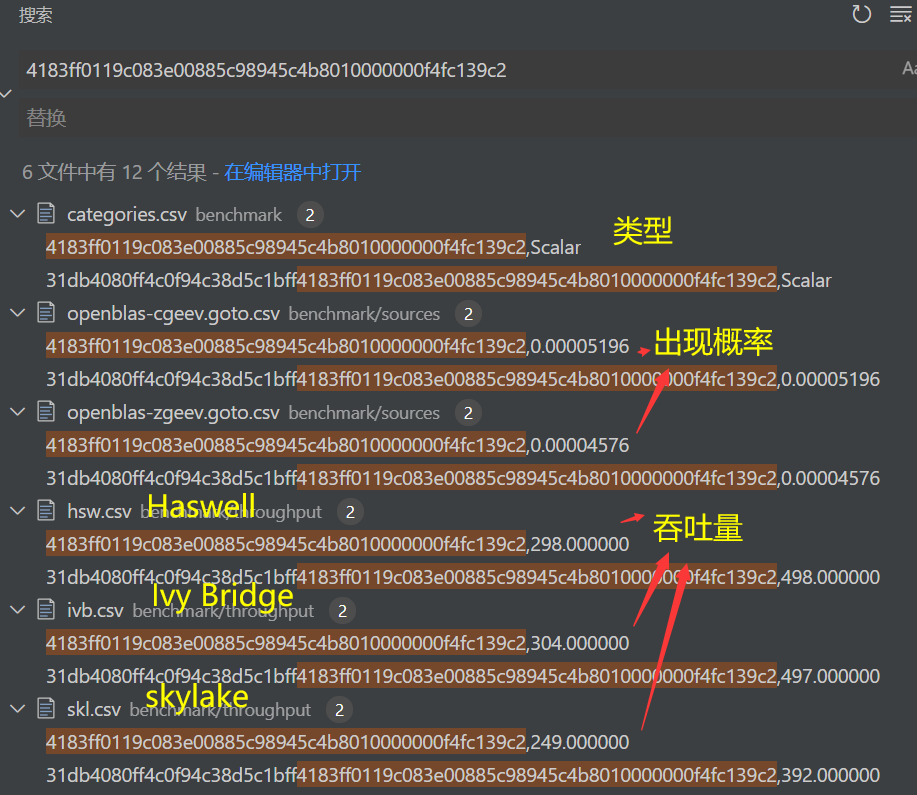
运用 Abel and Reineke A. Abel and J. Reineke, “uops.info: Characterizing latency, throughput, and port usage of instructions on intel microarchitectures,” in ASPLOS, 2019的结果 ???
例如???
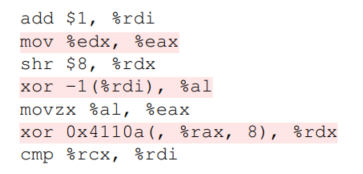
xor %rax, %rbx in Haswell is {p0156 → 1}
使用Latent Dirichlet Allocation (LDA)来构建topic model 模型(python 训练模型)
uops 的文章, Accurate Throughput Prediction of Basic Blocks on Recent Intel Microarchitectures
4.2 Extending BHive
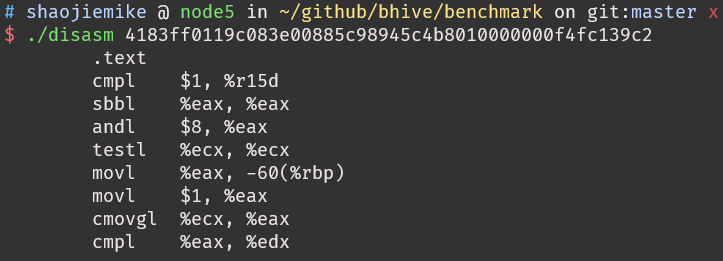
BHive 运行逻辑
读入16进制代码和循环次数
hhex2bin转换为二进制
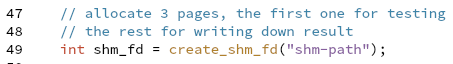
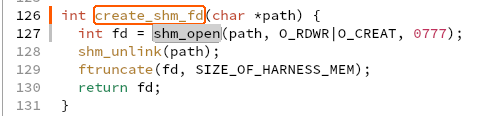
create_shm_fd
shm_open, shm_unlinkcreates and opens a new, or opens or unlink an existing, POSIX shared memory object. O_RDWR Open the object for read-write access.O_CREAT the shared memory object if it does not exist. 777是类似文件读写执行组权限的东西 On success, shm_open() returns a file descriptor (a nonnegative integer)
POSIX可移植操作系统接口The Portable Operating System Interface 是IEEE为要在各种UNIX操作系统上运行软件,而定义API的一系列互相关联的标准的总称。
ftruncate — truncate截短 a file to a specified length
#define SIZE_OF_HARNESS_MEM (4096 * 3)
measure开始测量
int fds[2] ???
pipe用于创建pipe,用来进程间通信的单向数据通路,传入变量用来返回引用自pipe末端的文件描述符file descriptors。第一个指向the read end of the pipe,第二个指向the write end of the pipe
mmap(void *addr, size_t length, int prot, int flags,int fd, off_t offset); munmap(void *addr, size_t length);- map or unmap files or devices into memory 在调用进程的虚拟地址空间里create a new mapping.
fork()产生子进程
fork()原理详解
复制之前的一模一样。
fork() returns a zero to the newly created child process.
fork() returns a positive value, the process ID of the child process, to the parent.
父进程
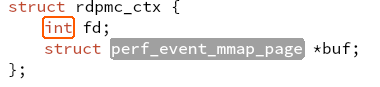
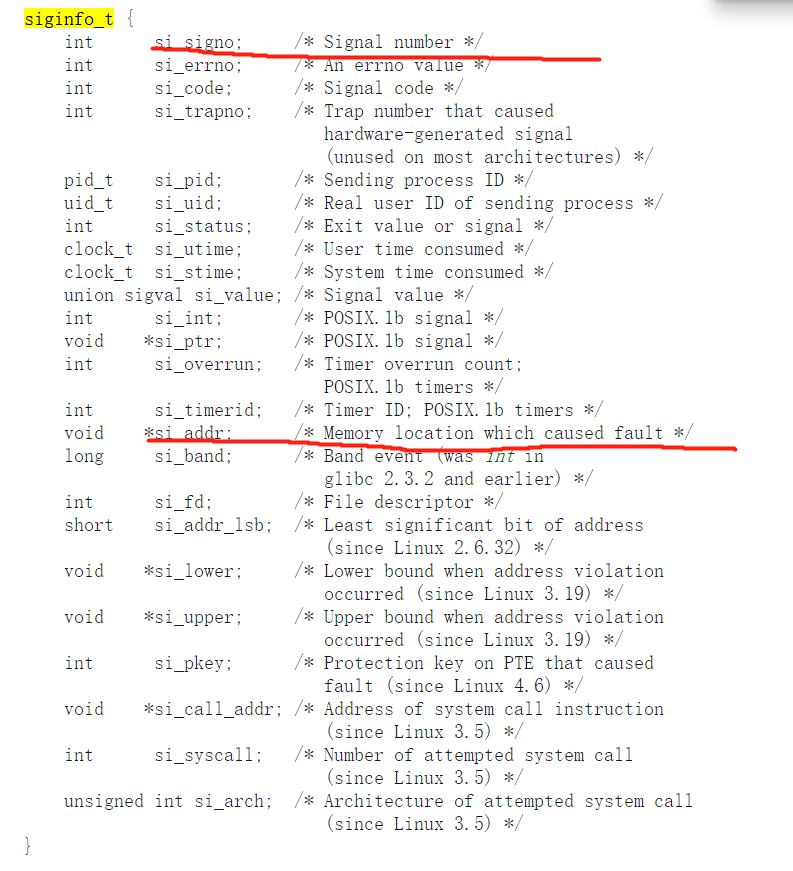
#define OFFSET_TO_COUNTERS 32
为什么声明一个偏移地址指针???
struct pmc_counters 由5个uint64_t组成。 uint64 will always take 8 bytes。一个结构体40bytes
attach_to_child(pid, fds[1]); pid是子进程pid
ptrace(enum __ptrace_request request, pid_t pid,void *addr, void *data) - process trace 提供一种进程tracer跟踪控制另一个进程tracee的方法,可以修改被控制者的memory and registers.
PTRACE_SEIZE Attach to the process specified in pid, making it a tracee of the calling process. Unlike PTRACE_ATTACH, PTRACE_SEIZE does not stop the process
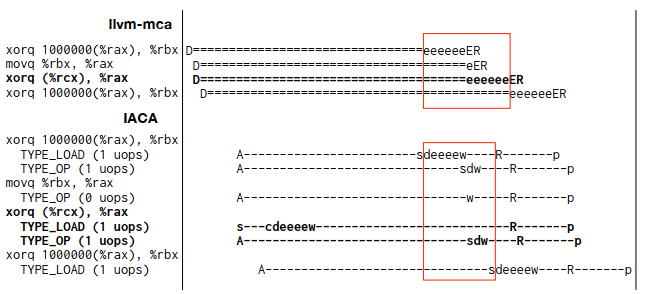
Average Wait times (based on the timeline view): [0]: Executions [1]: Average time spent waiting in a scheduler's queue [2]: Average time spent waiting in a scheduler's queue while ready [3]: Average time elapsed from WB until retire stage


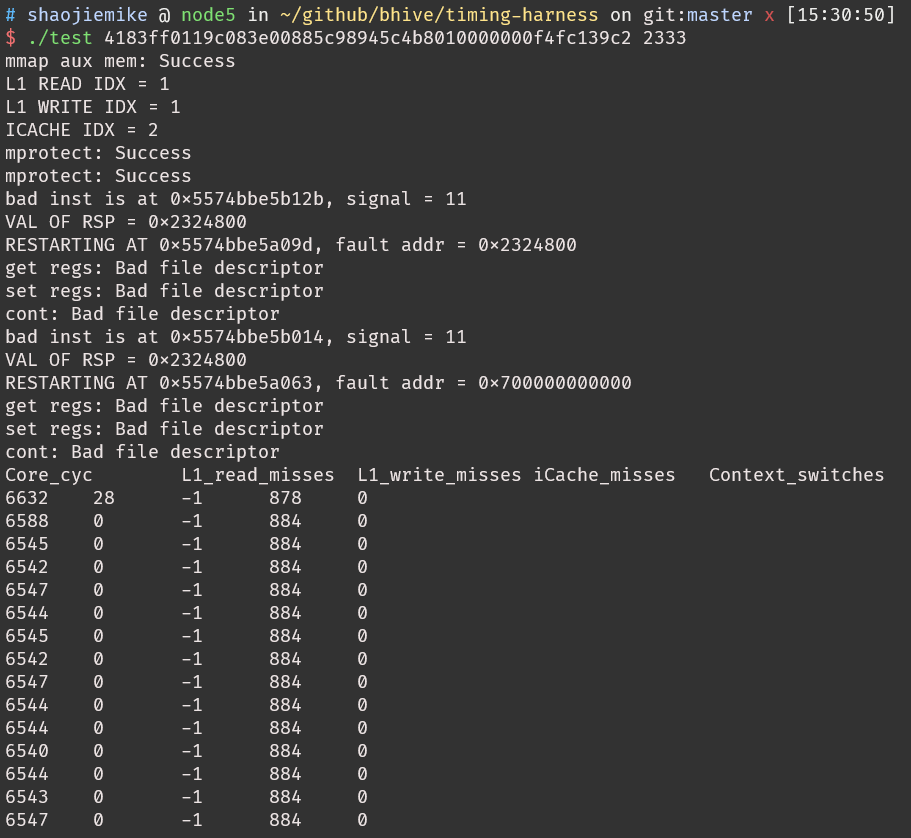
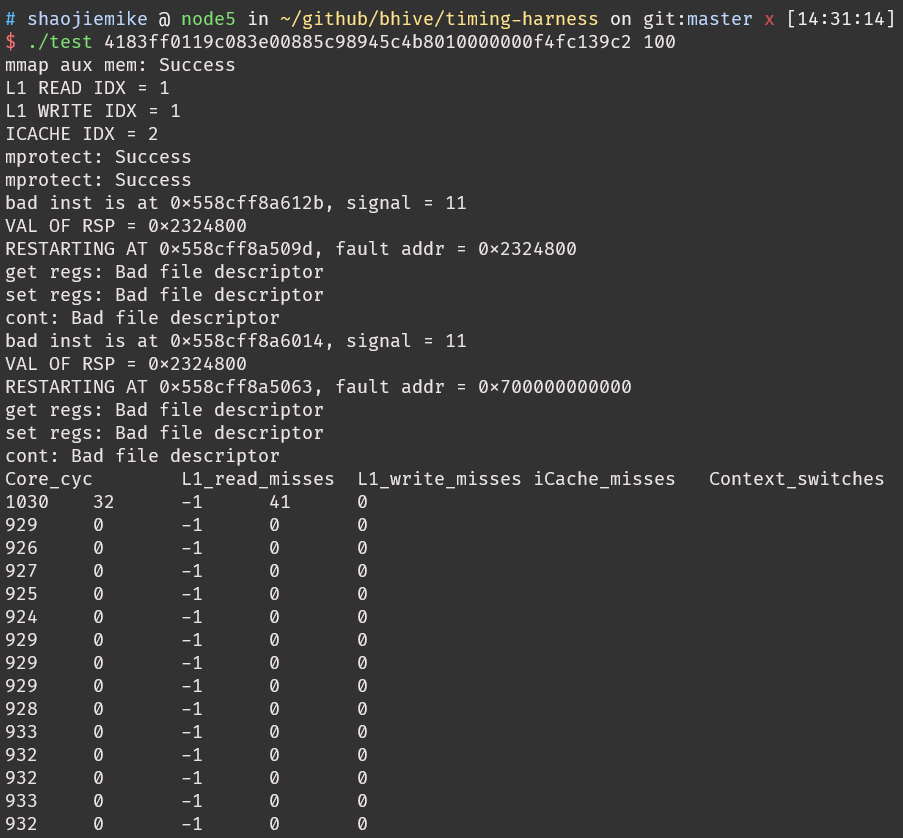
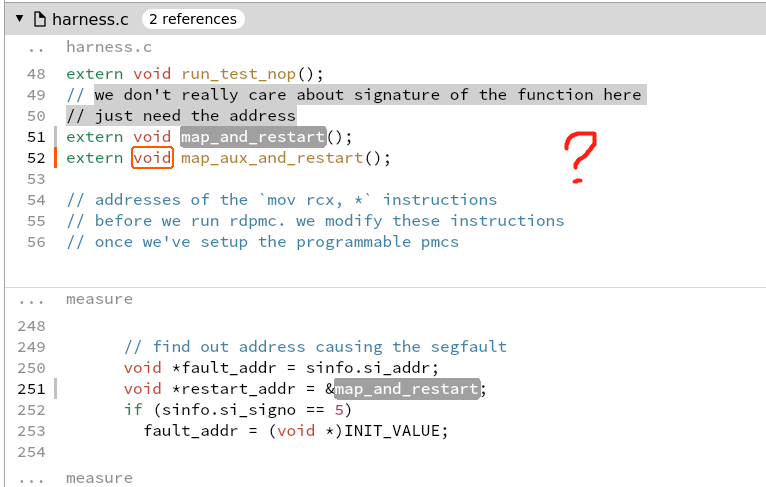

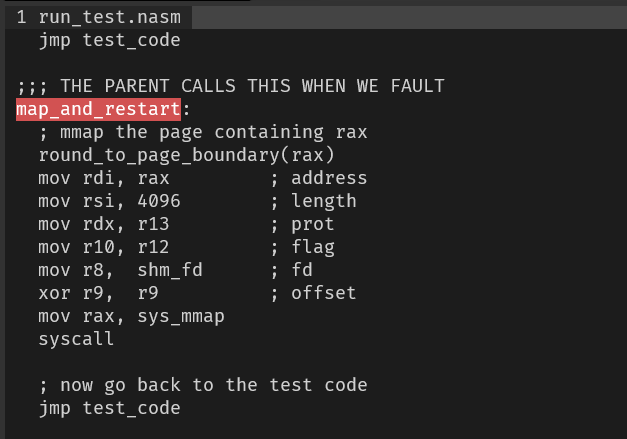
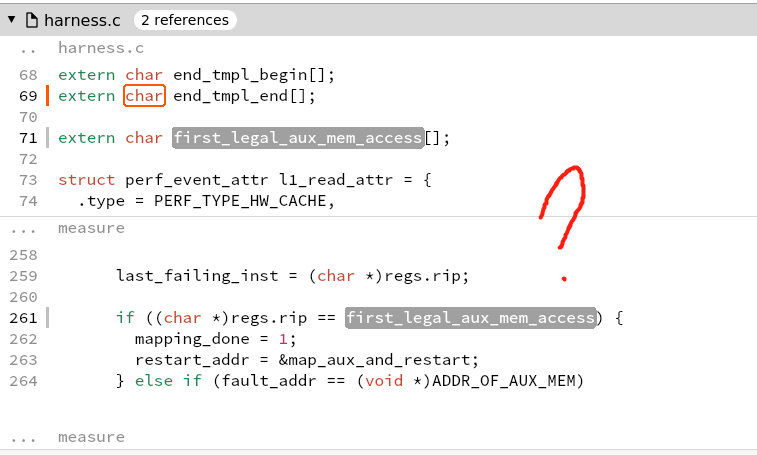
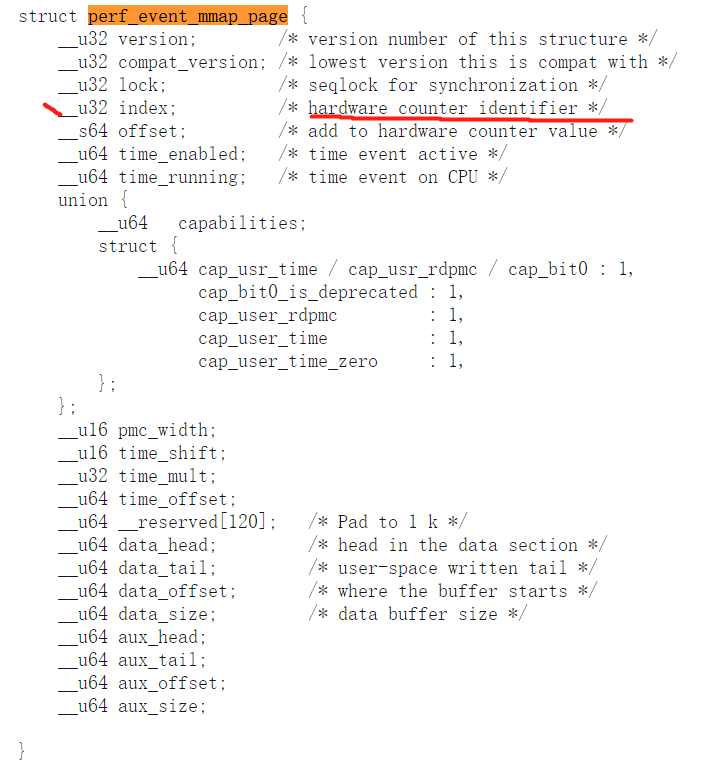
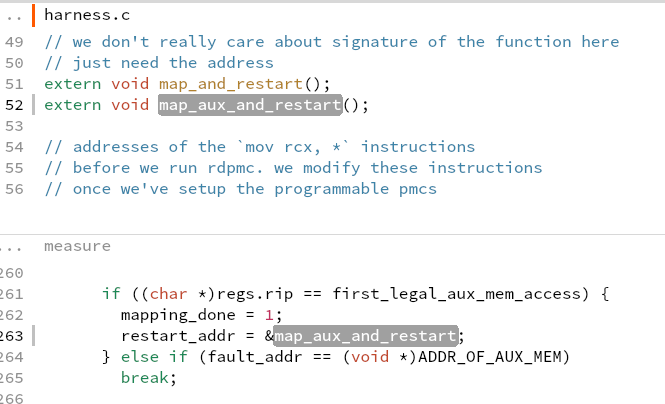 what is aux mem?