导言
The CUDA Execution Model: how the CUDA architecture handles the execution of code in parallel.
这篇将聚焦于CUDA的基础知识,基本概念,
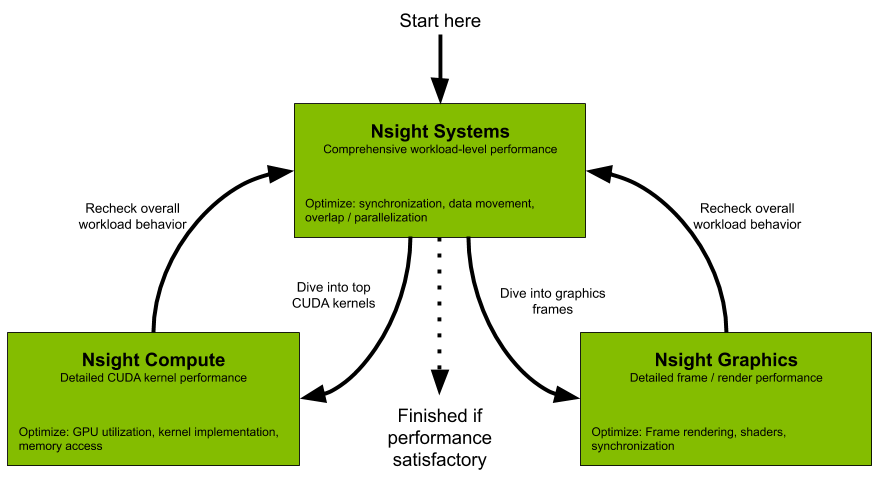
All developers should start with Nsight Systems to identify the largest optimization opportunities. Nsight Systems provides developers a system-wide visualization of an applications performance. Developers can optimize bottlenecks to scale efficiently across any number or size of CPUs and GPUs; from large servers to our smallest SoC. For further optimizations to compute kernels developers should use Nsight Compute or to further optimize a graphics workloads, use Nsight Graphics.
Nsight Compute is an interactive kernel profiler for CUDA applications. It provides detailed performance metrics and API debugging via a user interface and command line tool. Nsight Compute also provides customizable and data-driven user interface and metric collection that can be extended with analysis scripts for post-processing results.
Nsight Graphics is a standalone application for the debugging, profiling, and analysis of graphics applications on Microsoft Windows and Linux. It allows you to optimize the performance of your Direct3D 11, Direct3D 12, DirectX Raytracing 1.1, OpenGL, Vulkan, and KHR Vulkan Ray Tracing Extension based applications.
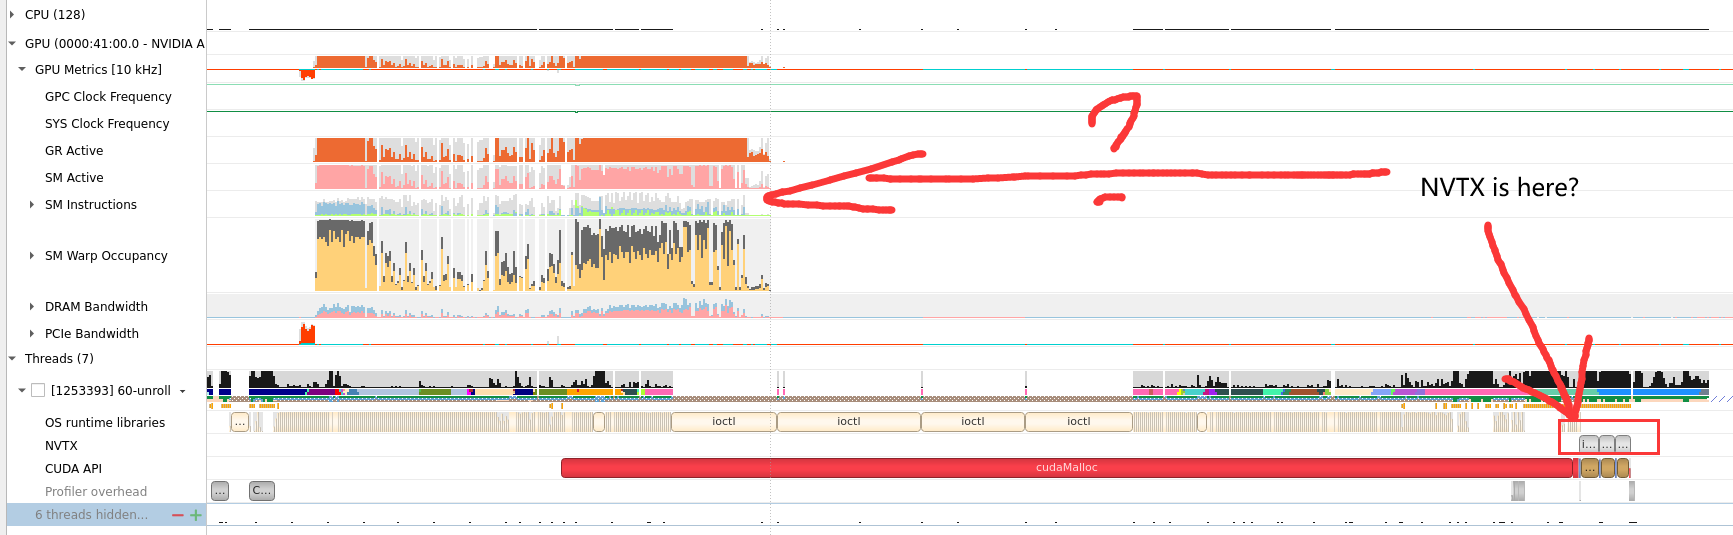
cat /proc/sys/kernel/perf_event_paranoidsudo sh -c 'echo 2 >/proc/sys/kernel/perf_event_paranoid'重启会重置sudo sh -c 'echo kernel.perf_event_paranoid=2 > /etc/sysctl.d/local.conf'运行 nsight-sys,可以从整体上看GPU,CPU资源的使用情况,和分辨出热点函数和kernel,但是对于为什么是热点给不出具体分析。
勾选了CUDA-trace, GPU Metrics选项
大致2到3倍时间:默认采样率,单独运行52s, Nsight-sys模拟需要135s。
GPU Metrics选项能看出 PCIE, GPU DRAM Bandwidth, Warp的使用情况。
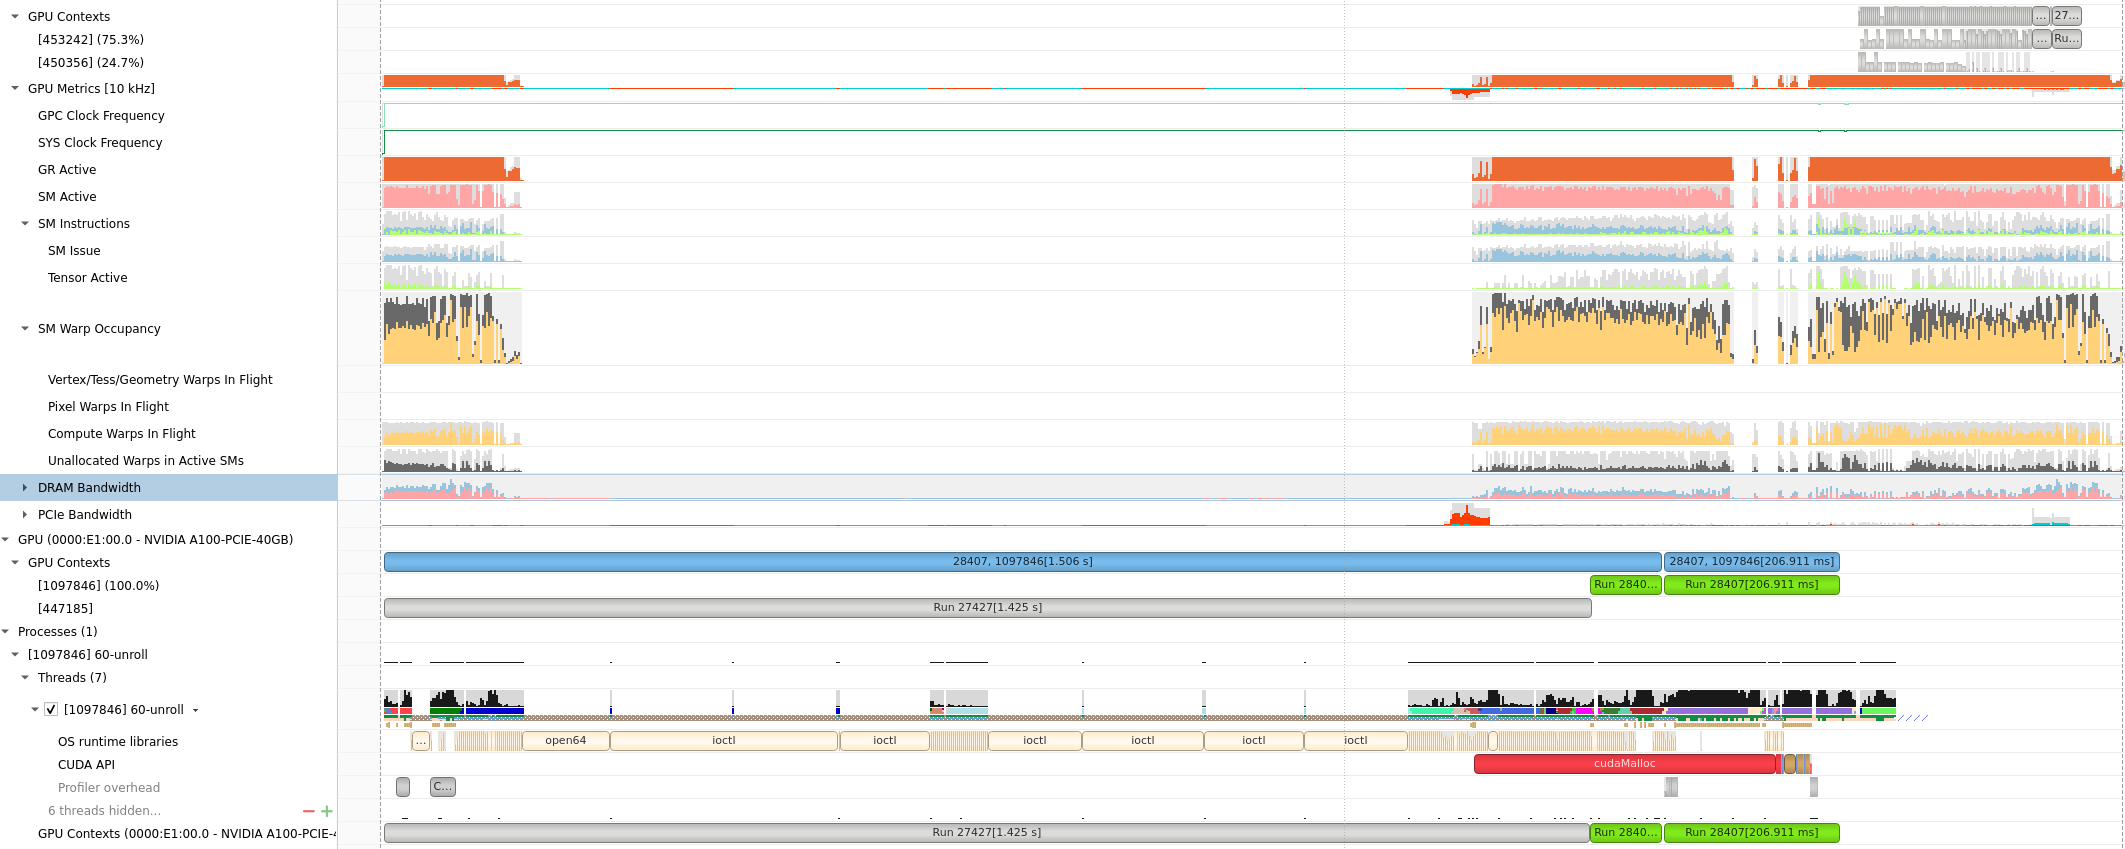
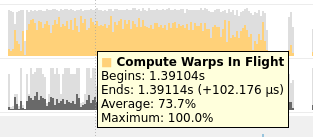
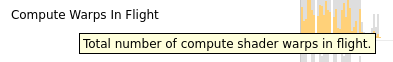
将鼠标放在上面会有具体的数值或者名称的解释,(正在使用的Warps)
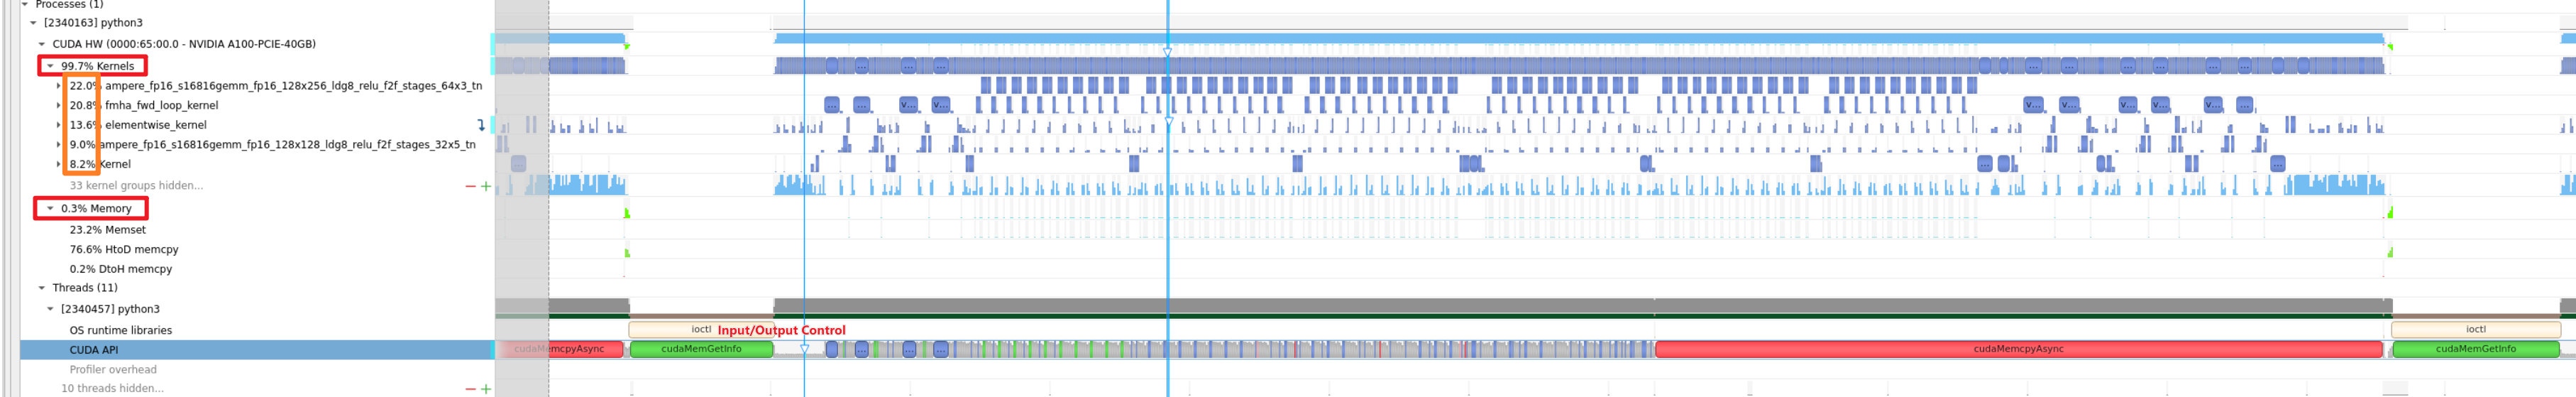
由于没有根据kernel function区分,很难读。为此提供了NVTX来给代码打标签
具体分析见 Deploy Stable Diffusion to A100
默认kernel模式,会根据 function的调度关系,将程序划分为kernel
1 | # recommand running under sudo |
目测模拟时间慢百倍。
nv-nsight-cu-cli -> ncu
下面是一个使用样例:
1 | /usr/local/NVIDIA-Nsight-Compute/nv-nsight-cu-cli -o mnist -f --csv --profile-from-start off /usr/bin/python3 mnist.py |
其中-o是为了输出.nsight-cuprof-report文件用于后续的可视化查看,-f为强制覆盖原有文件,–csv可是在console输出除 timeline 以外数据的时候以逗号分隔数据,方便拷贝至csv文件, –profile-from-start的使用方法和Nsight System以及nvprof一样。其余flag选项可见文档。
上面的例子会生成mnist.nsight-cuprof-report文件。
注意
最前面的可执行文件需要绝对路径,如上面的python3需要使用 /usr/bin/python3。
生成过程中可能会产生很大的临时文件(几十G)。如果本次磁盘空间不够,可以设置如下环境变量来调整存储临时文件的地址。没有找到能直接使用 Nsight Compute 修改临时文件地址的方式。
1 | export /TMPDIR=/path/for/tmp |
https://www.freesion.com/article/34871449930/
为了显示原代码makefile添加 -g -G选项
对应CmakeList.txt
1 | target_compile_options(better PUBLIC $<$<COMPILE_LANGUAGE:CUDA>:--extended-lambda |
https://blog.csdn.net/yan31415/article/details/109491749
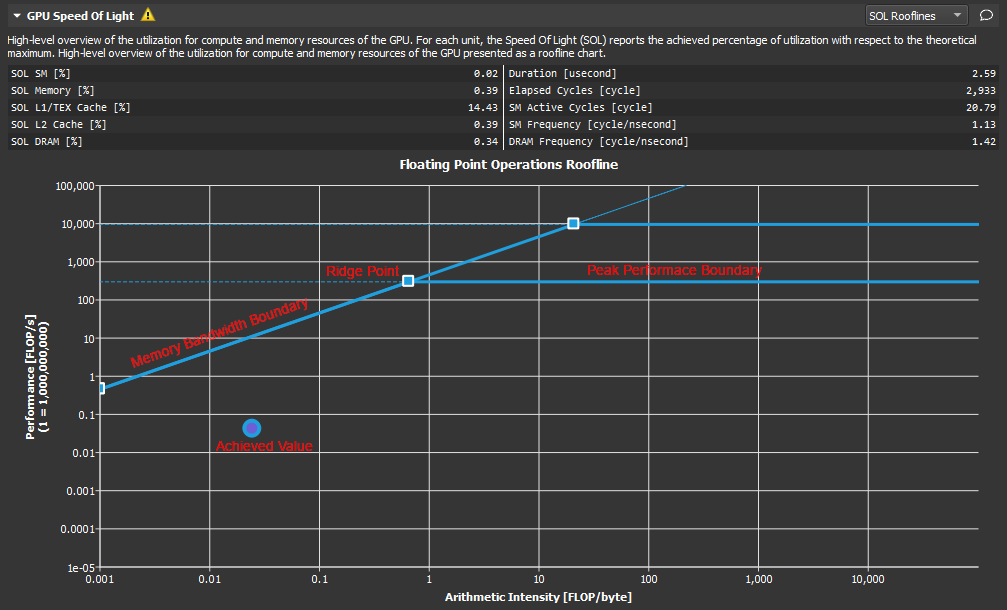
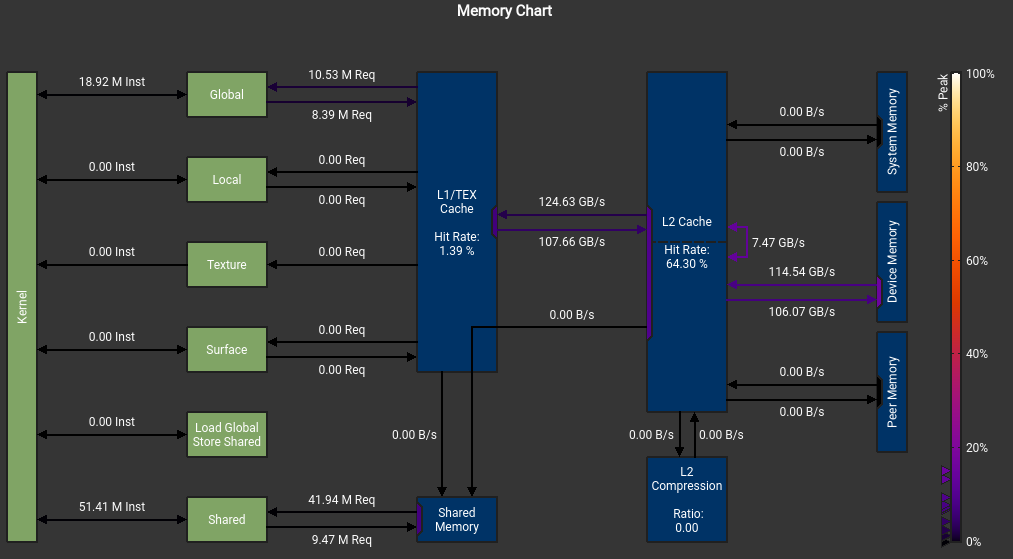
我不明白我的SMEM怎么不是从DRAM来的, 而且峰值怎么这么低?
这个错误也是令人迷惑
The memory access pattern for loads from L1TEX to L2 is not optimal. The granularity of an L1TEX request to L2 is a 128 byte cache line. That is 4 consecutive 32-byte sectors per L2 request. However, this kernel only accesses an average of 3.7 sectors out of the possible 4 sectors per cache line. Check the Source Counters section for uncoalesced loads and try to minimize how many cache lines need to be accessed per memory request.
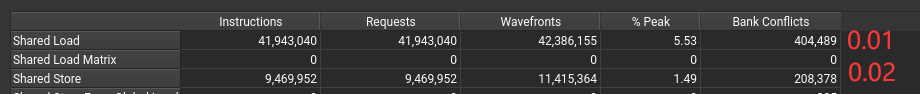
不知道为什么有1%和2% 的bank conflict
可以看到 SMEM, Register,Block Size是怎么影响GPU Warp的分配调度的。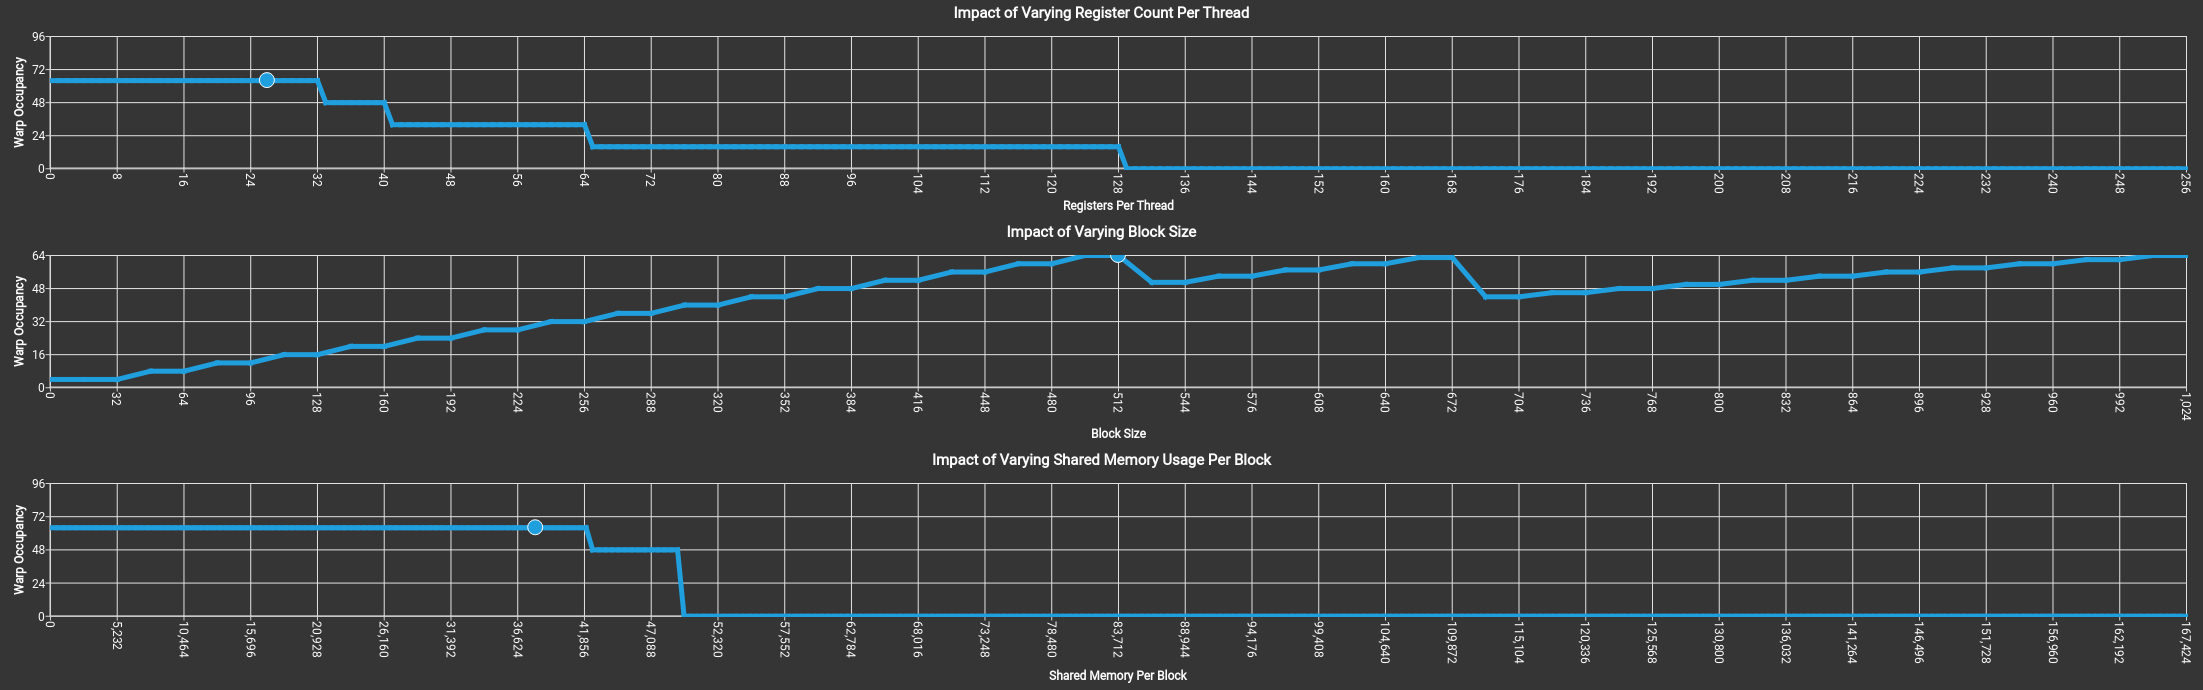
上图没有拖累,吃满了64个warp。
关于if语句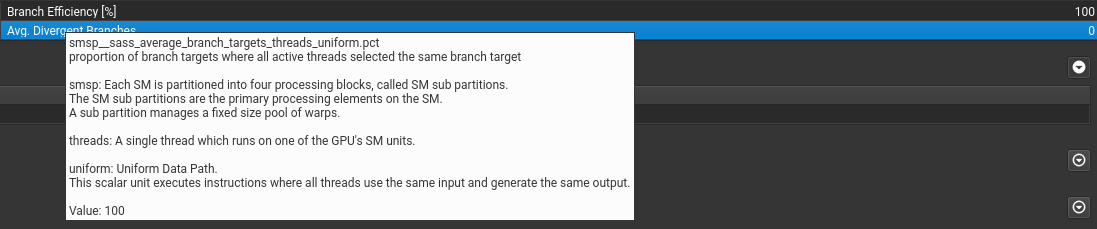
if语句只要warp里执行相同就行。
可以提示出不连续访问的地方。(这里是这样设计的,已经避免了绝大部分的不连续访问)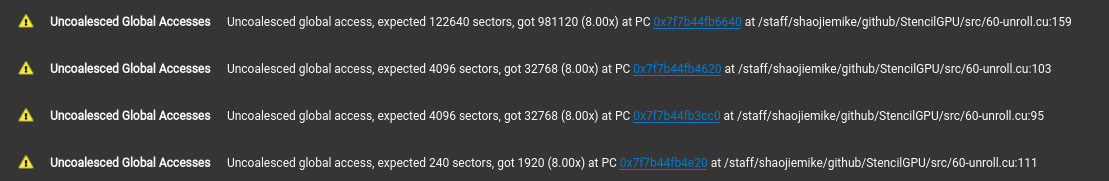
显示stall最多的指令是什么以及在等待什么。还有执行最多的指令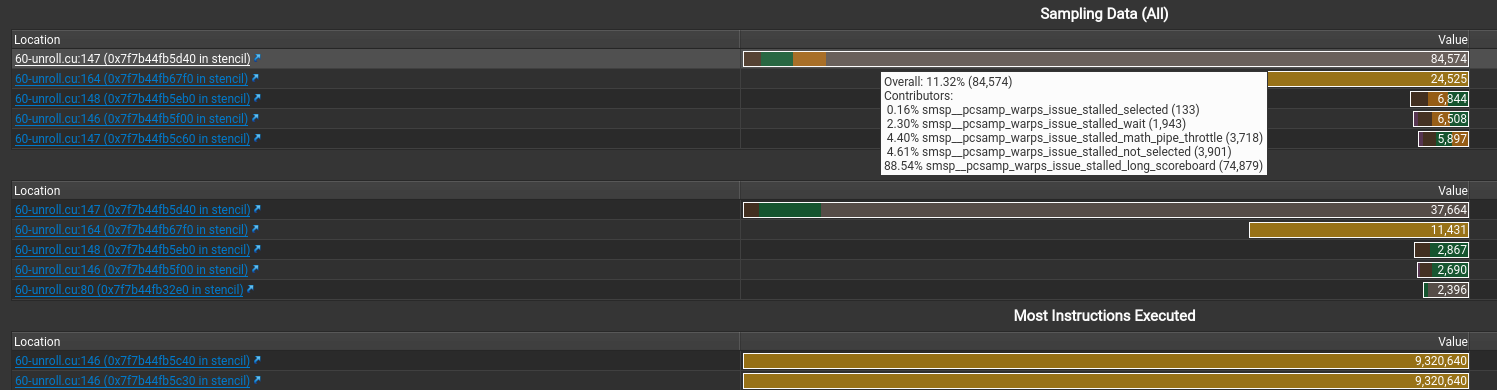
假如 file mismatched 手动选择文件就行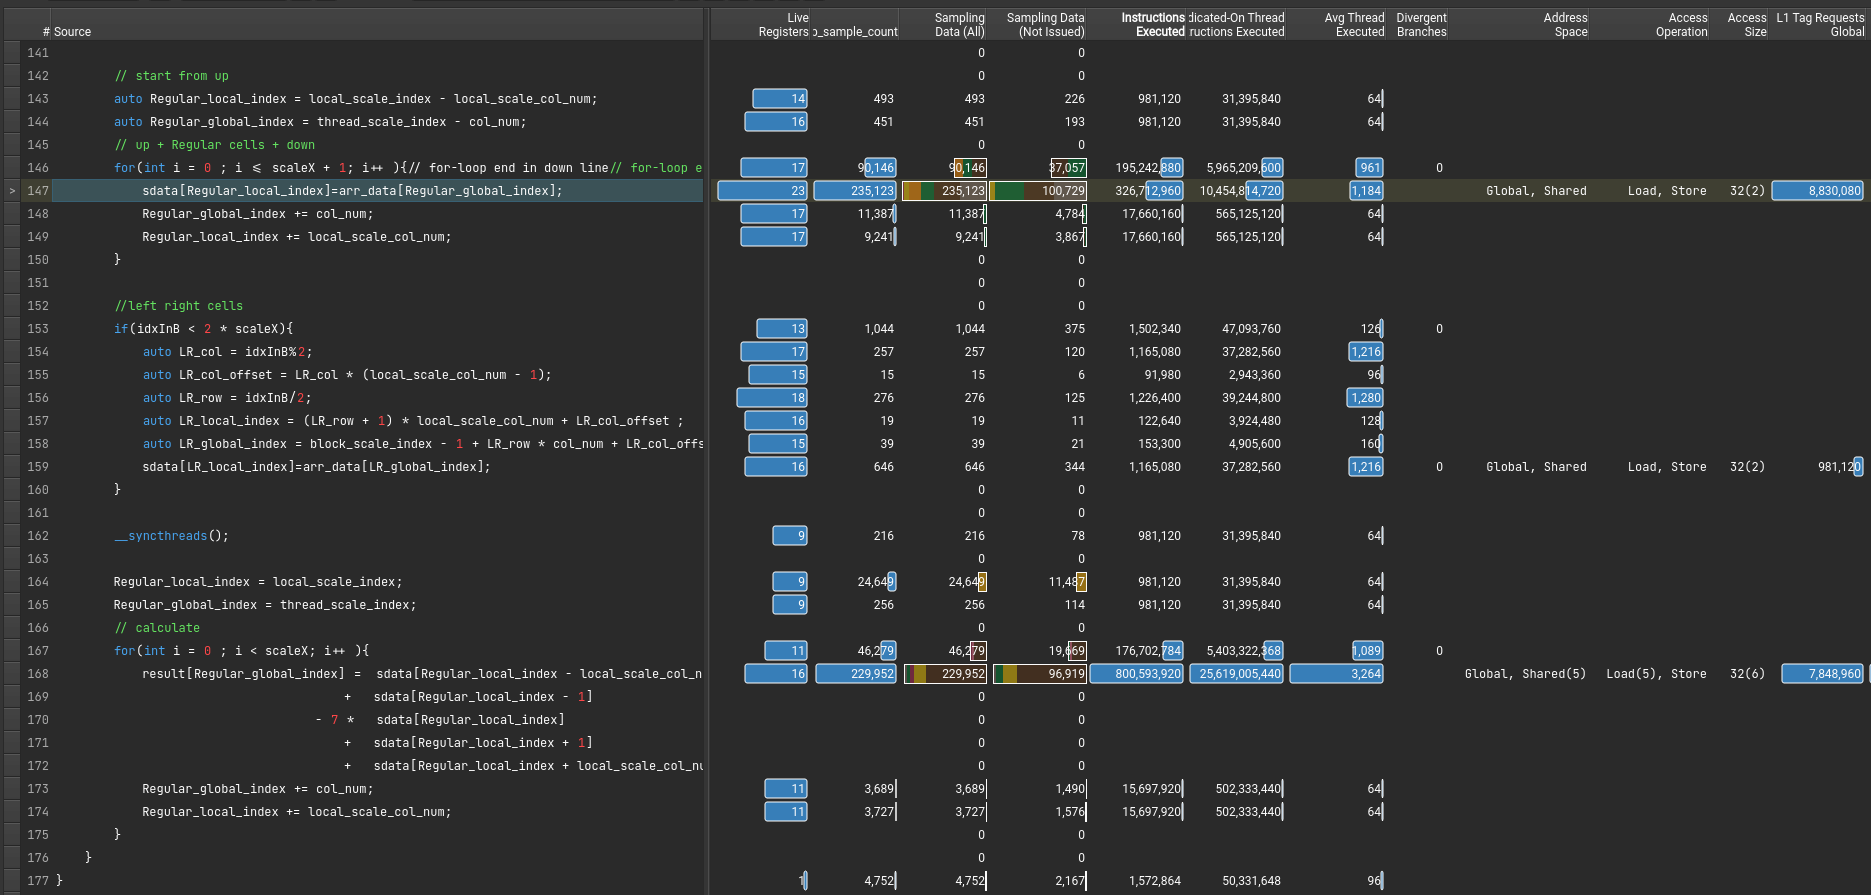
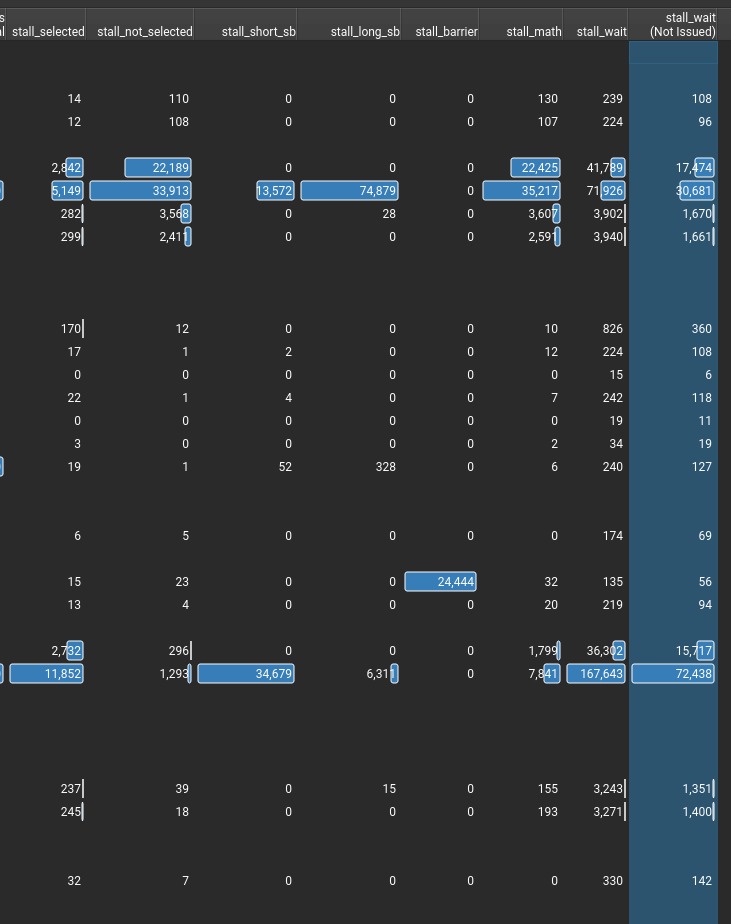
stall的信息,感觉就这些有点用。(其中sb是scoreboard的意思)
有两种汇编
请看PTX SASS一文
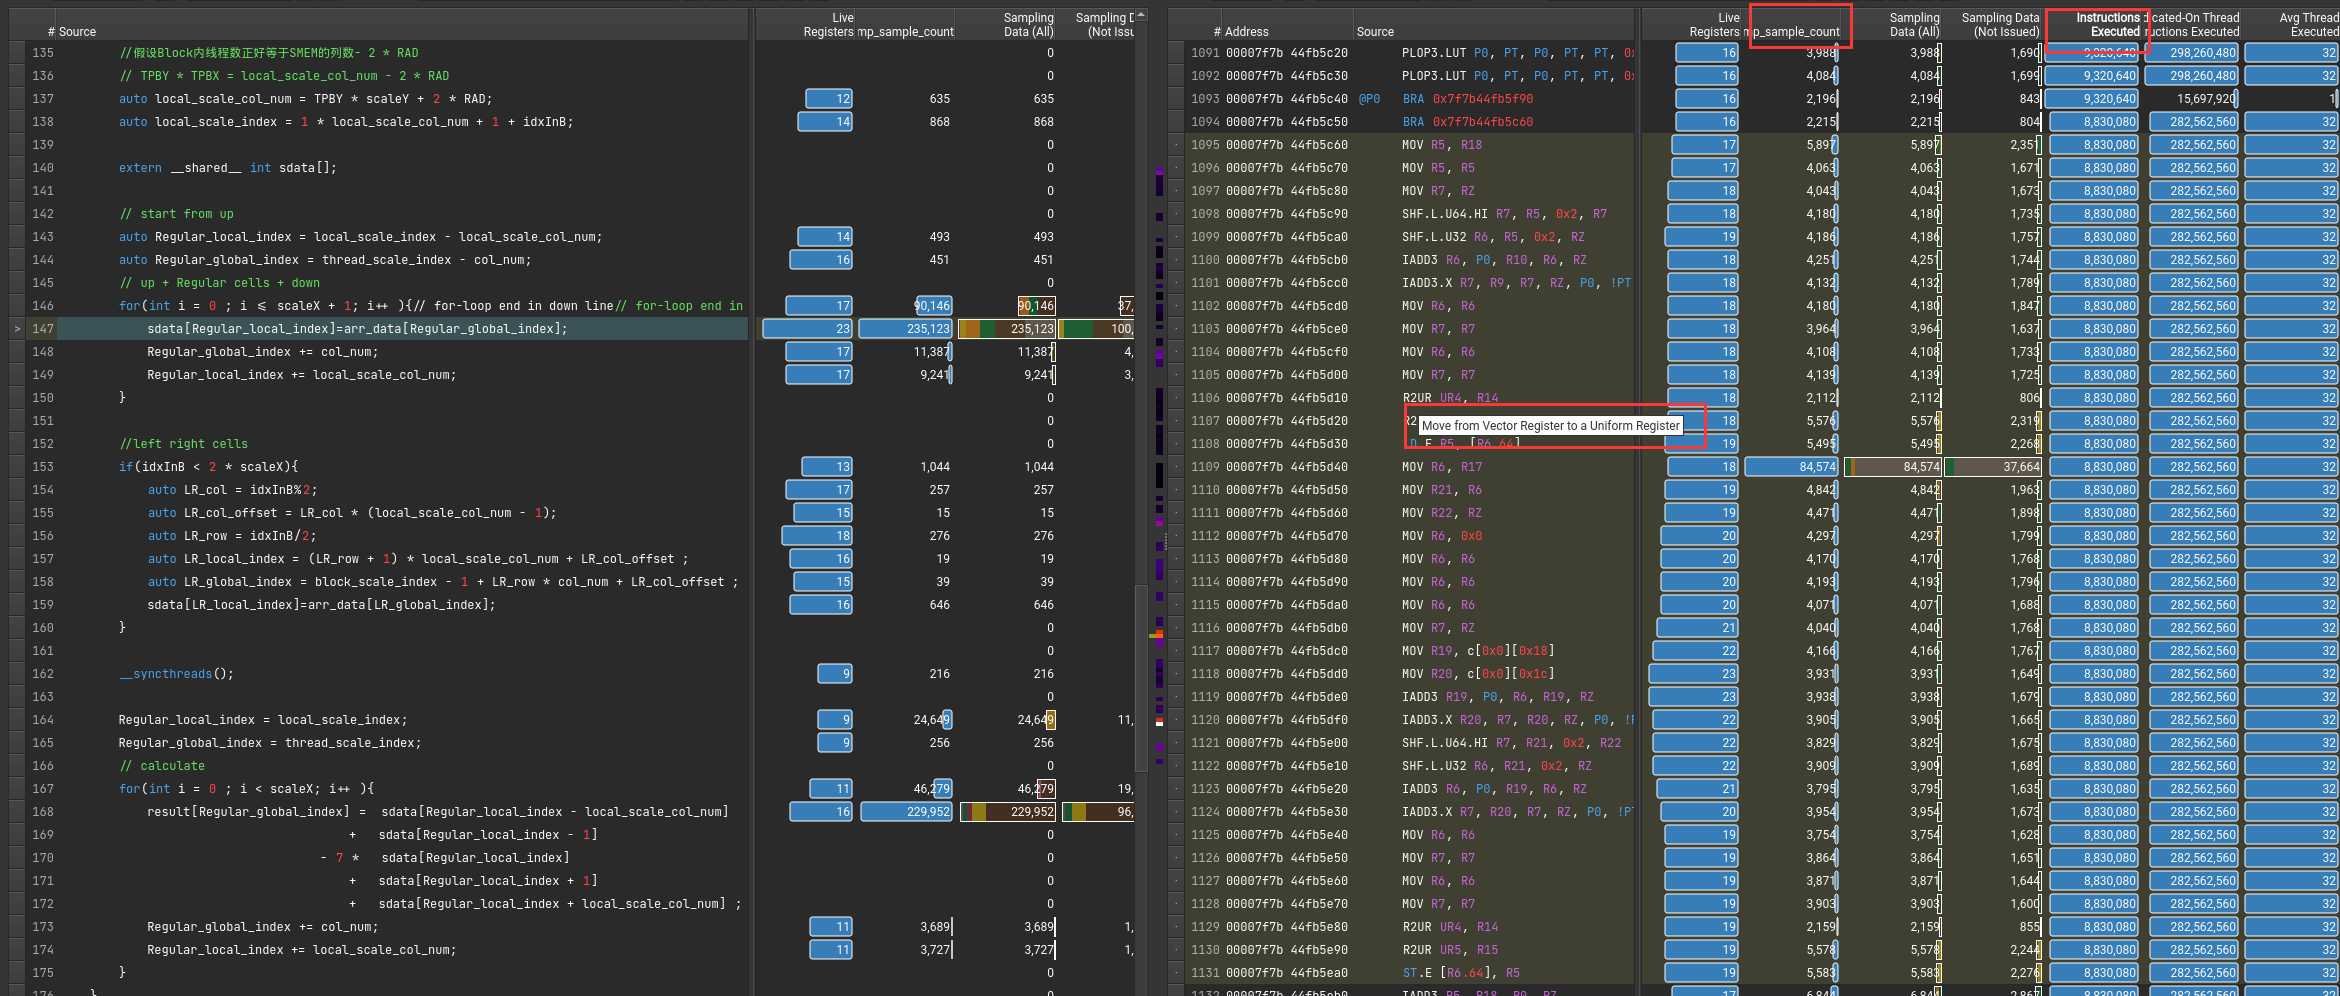
可以通过指令执行数或者采样率来得知,执行最多的指令。
鼠标悬停可以知道具体命令的含义
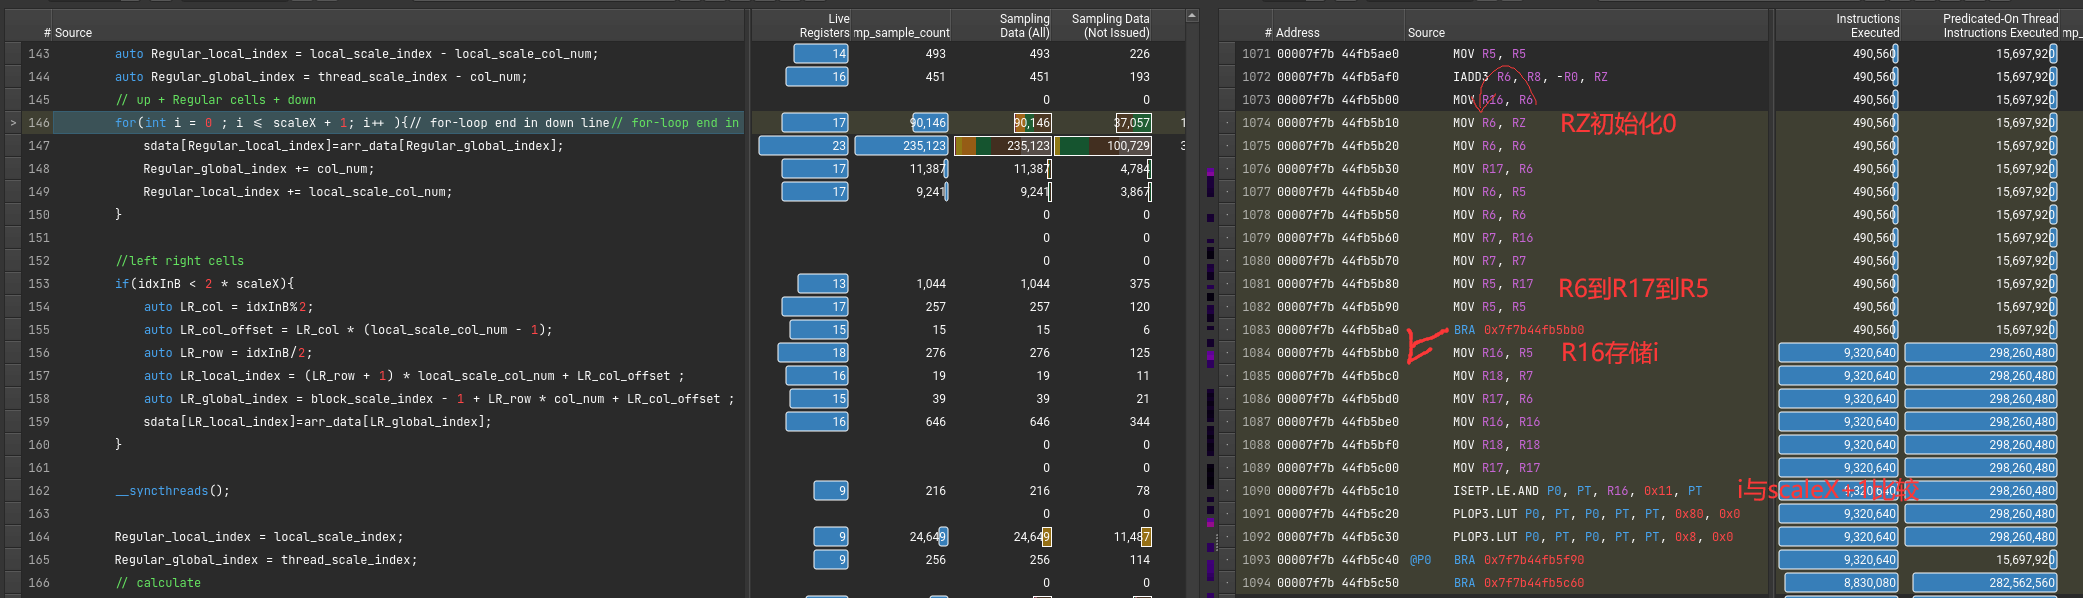
1 | sdata[Regular_local_index]=arr_data[Regular_global_index]; |
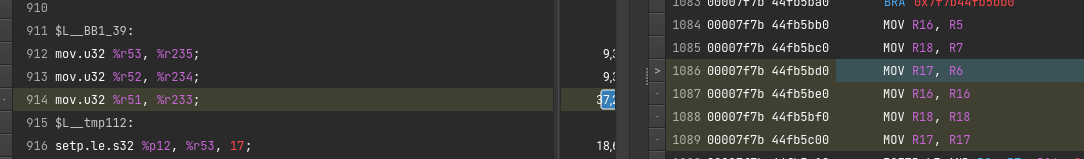
该从DRAM里读取到SMEM的指令对应的PTX和SASS代码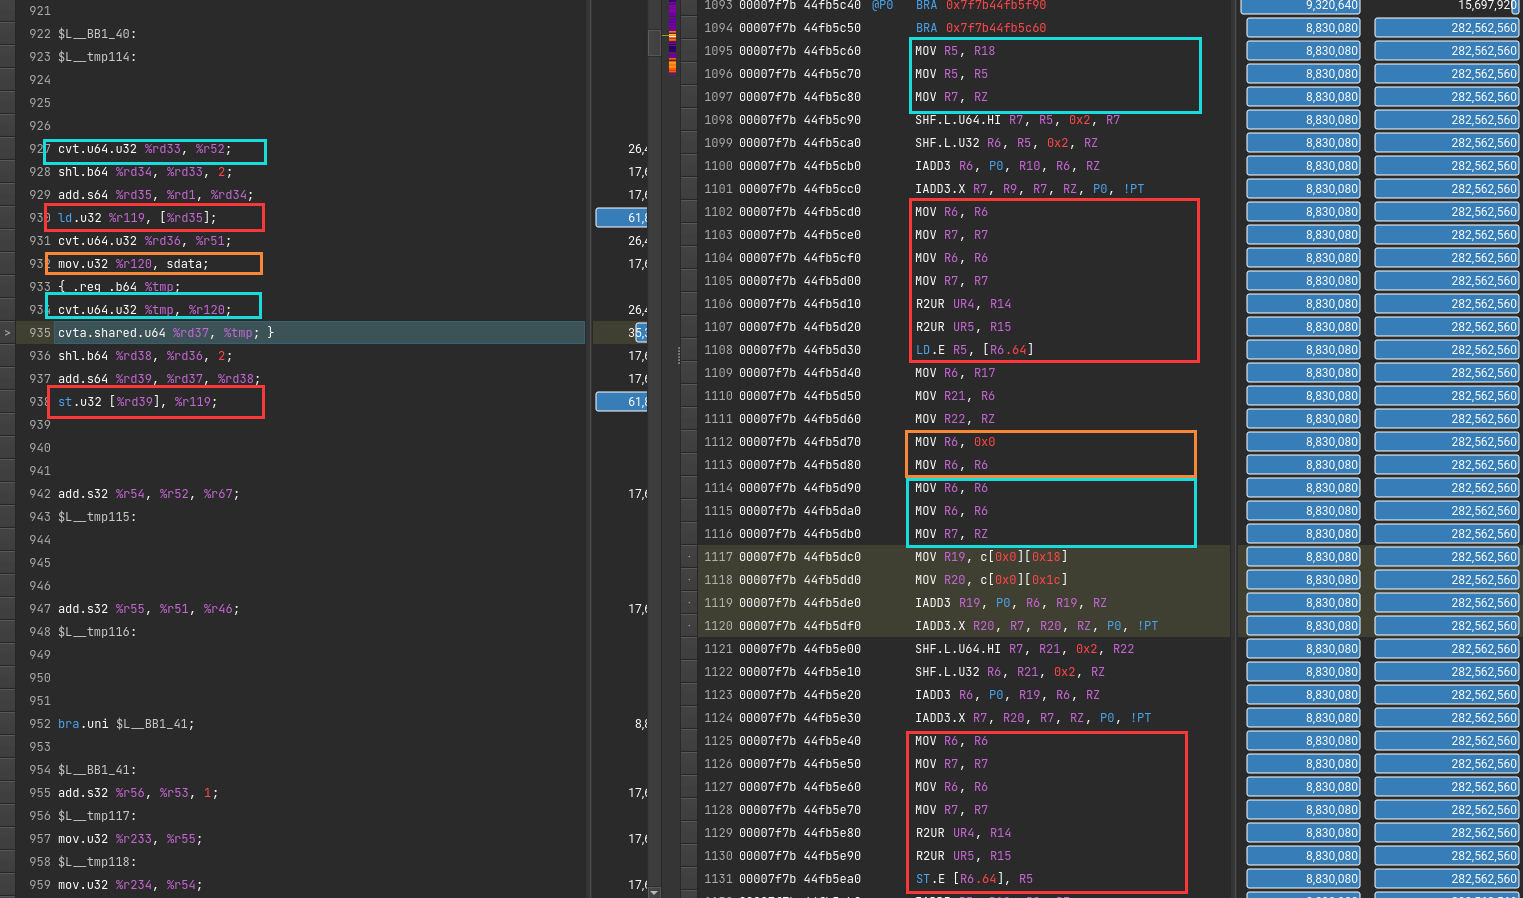
1 | cvt.f32.u16 d, a; // convert 16-bit unsigned to 32-bit float |
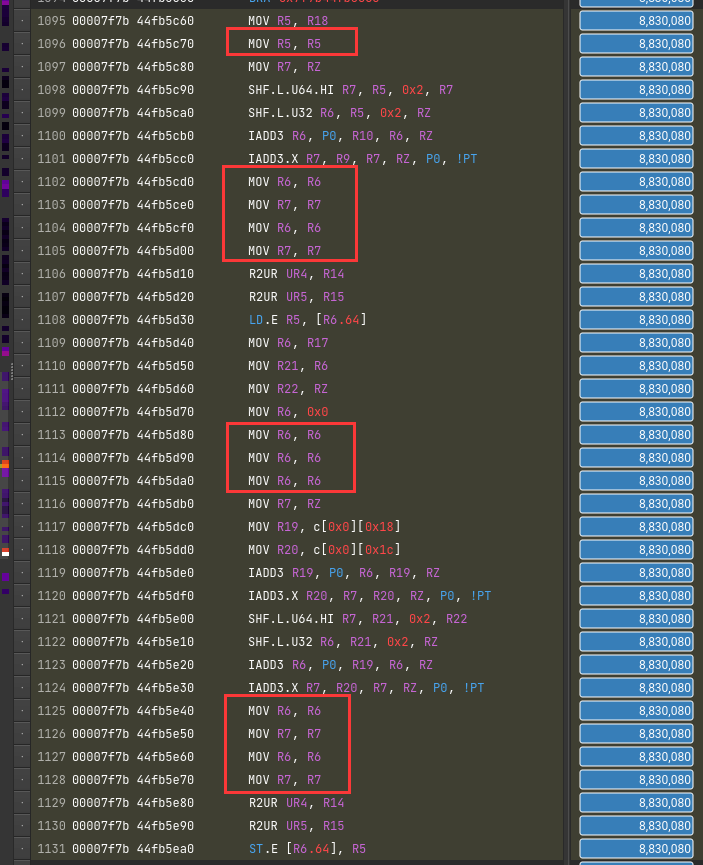
为了隐藏延迟?
直接原因是PTX翻译成SASS。一条mov变多条了
老一代debugger工具,逐渐被Nsight淘汰
1 | nvprof # 命令行,nsys 之前的名称叫做 nvprof |
在more里有建议
1 | nvprof --analysis-metrics -o nbody-analysis.nvprof ./nbody --benchmark -numdevices=2 -i=1 |
1 | Warning: Failed to get OpenGL version. OpenGL version 2.0 or higher is required. |
解决办法
1 | sudo apt-get install libxcb-xinerama0 |
1 | qt.qpa.plugin: Could not load the Qt platform plugin "xcb" in "" even though it was found. |
按照说明 export QT_DEBUG_PLUGINS=1再次运行, 显示具体问题
1 | Cannot load library /staff/shaojiemike/Install/cuda_11.7.0_515.43.04_linux/nsight-compute-2022.2.0/host/linux-desktop-glibc_2_11_3-x64/Plugins/platforms/libqxcb.so: (libxcb-xinput.so.0: cannot open shared object file: No such file or directory) |
解决 sudo apt-get install libxcb-xinput0
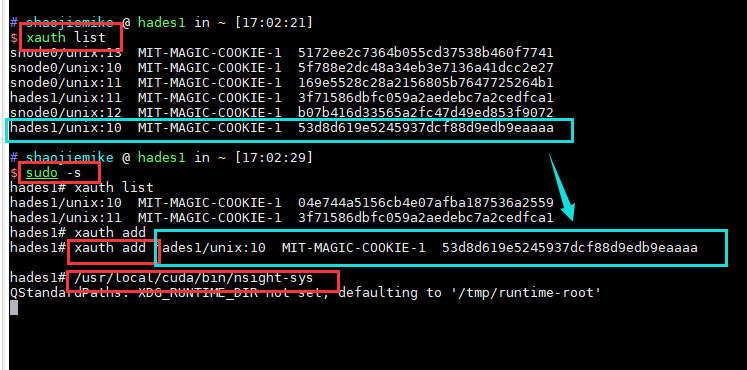
ERR_NVGPUCTRPERM - The user does not have permission to profile on the target device
要用sudo,或者最新的NV
1 | $ sudo ncu-ui |
解决办法(原因是sudo相当于切换到root用户,丢失了xauth信息)
1 | $ xauth list |
原因是 软件对GPU的支持是逐步的需要安装最新的。
不支持的Nsight的可以尝试老的debugger工具 CUDA Visual Profiler
Pascal support was deprecated, then dropped from Nsight Compute after Nsight Compute 2019.5.1.
The profiling tools that support Pascal in the CUDA Toolkit 11.1 and later are nvprof and visual profiler.
暂无
NVTX问题
https://developer.nvidia.com/tools-overview
https://www.365seal.com/y/zyn1yxJQn3.html
[^1]: Usage of NVTX
CUDA编程水平高低的不同,会导致几十上百倍的性能差距。但是这篇将聚焦于CUDA的编程语法,编译与运行。
Cuda Optimize : Vectorized Memory Access
1 | __global__ void device_copy_scalar_kernel(int* d_in, int* d_out, int N) { |
简单的分块拷贝。
通过cuobjdump -sass executable.得到对应的标量copy对应的SASS代码
1 | /*0058*/ IMAD R6.CC, R0, R9, c[0x0][0x140] |
(SASS不熟悉,请看SASS一文)
其中4条IMAD指令计算出读取和存储的指令地址R6:R7和R4:R5。第4和6条指令执行32位的访存命令。
通过使用int2, int4, or float2
比如将int的指针d_in类型转换然后赋值。
1 | reinterpret_cast<int2*>(d_in) |
但是需要注意对齐问题,比如
1 | reinterpret_cast<int2*>(d_in+1) |
这样是非法的。
通过使用对齐的结构体来实现同样的目的。
1 | struct Foo {int a, int b, double c}; // 16 bytes in size |
执行for循环次数减半,注意边界处理。
1 | __global__ void device_copy_vector2_kernel(int* d_in, int* d_out, int N) { |
对应汇编可以看出
1 | /*0088*/ IMAD R10.CC, R3, R5, c[0x0][0x140] |
变成了LD.E.64
执行for循环次数减半,注意边界处理。
1 | __global__ void device_copy_vector4_kernel(int* d_in, int* d_out, int N) { |
对应汇编可以看出
1 | /*0090*/ IMAD R10.CC, R3, R13, c[0x0][0x140] |
变成了LD.E.128
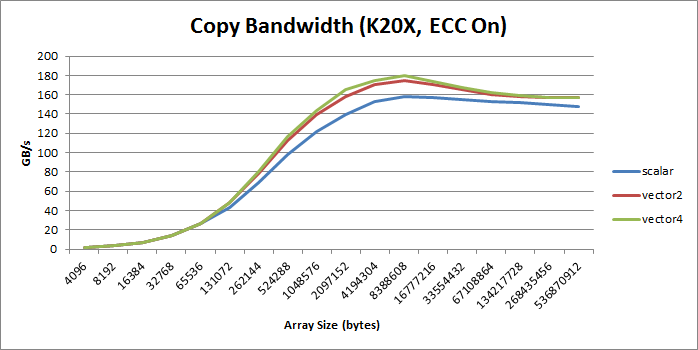
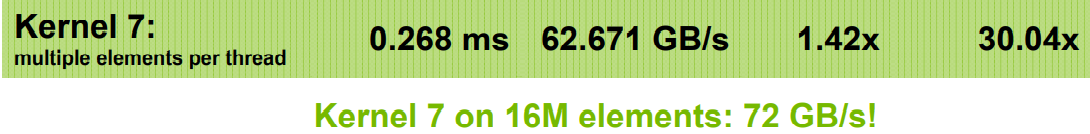
(个人感觉,提升也不大吗?也没有两倍和四倍的效果)
绝大部分情况,向量比标量好, increase bandwidth, reduce instruction count, and reduce latency. 。
但是会增加额外的寄存器(SASS里也没有看到??)和降低并行性(什么意思???)
有对应的PPT,代码。
最终将1000ms程序优化到1~2ms
乔良师兄有根据知乎介绍如何利用寄存器文件缓存
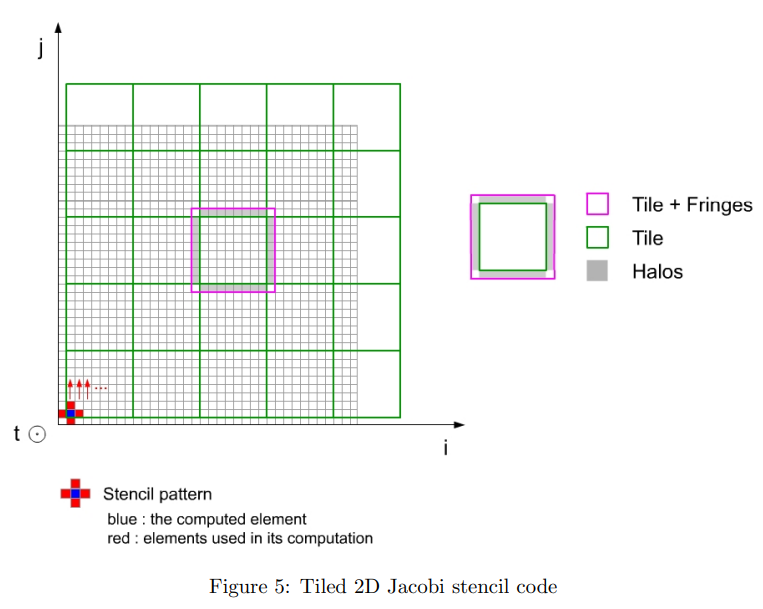
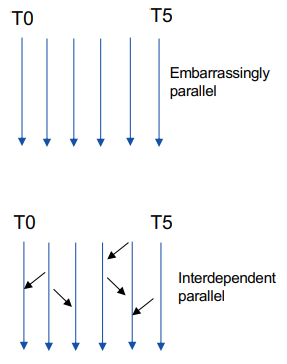
导致Embarrassingly Parallel Problems
计算某点的梯度,需要前后的function值。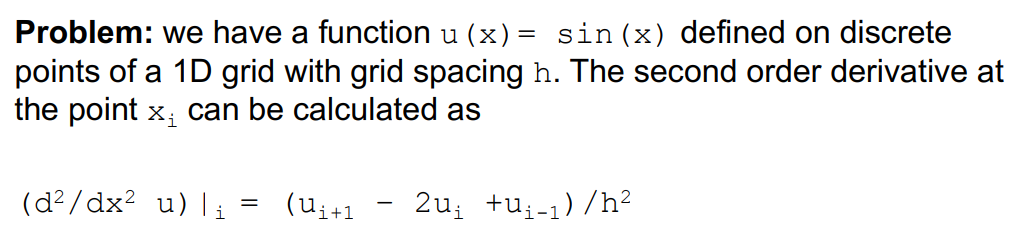
问题:
对于边界上的cells,需要访问相邻区域的元素。
解决办法:
将他们也加入进当前block的SMEM
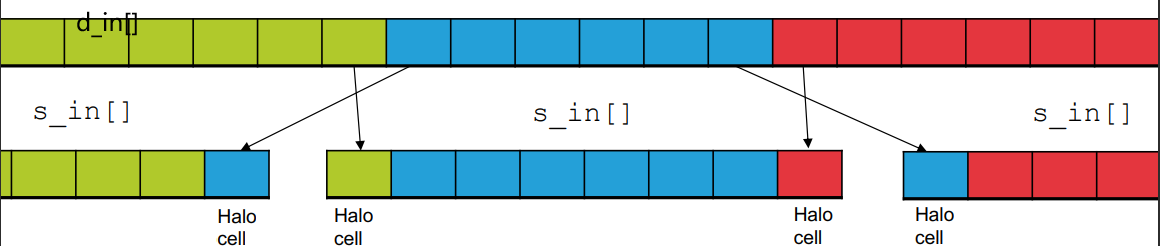
s_idx = threadIdx.x + RAD;1 | int main() { |
Kernel Launching
1 | #define TPB 64 |
Kernel Definition
1 | __global__ void ddKernel(float *d_out, const float *d_in, int size, float h) { |
暂无
暂无
研一下USTC并行计算自己的选题
如果我们数据只会在 GPU 产生和使用,我们不需要来回进行拷贝。
https://migocpp.wordpress.com/2018/06/08/cuda-memory-access-global-zero-copy-unified/
简而言之,在 host 使用命令:cudaHostRegisterMapped
之后用 cudaHostGetDevicePointer 进行映射
最后解除绑定 cudaHostUnregister
即,
1 | // First, pin the memory (or cudaHostAlloc instead) |
只要两个thread在 同一个warp中,允许thread直接读其他thread的寄存器值,这种比通过shared Memory进行thread间的通讯效果更好,latency更低,同时也不消耗额外的内存资源来执行数据交换。ref
对齐(Starting address for a region must be a multiple of region size)集体访问,有数量级的差异Coalesced
利用好每个block里的thread,全部每个线程各自读取自己对齐(Starting address for a region must be a multiple of region size 不一定是自己用的)数据到shared memory开辟的总空间。由于需要的数据全部合力读取进来了,计算时正常使用需要的读入的数据。
特别是对于结构体使用SoA(structure of arrays)而不是AoS(array of structures),
如果结构体实在不能对齐, 可以使用 __align(X), where X = 4, 8, or 16.强制对齐。
__syncthreadsself-tuning出来占用率是指每个多处理器(Streaming Multiprocessor,SM)的实际的活动warps数量与最大理论的warps数量的比率。
高的占用率不一定能提升性能,因为这一般意味着每个线程分配的寄存器和shared memory变少。但低的占用率会导致内存延迟无法隐藏。
实际需要计算每个线程大概需要的shared memory和register数量
https://www.cnblogs.com/1024incn/p/4541313.html
https://www.cnblogs.com/1024incn/p/4545265.html
通过SMEM实现coalescing access
原本代码
1 | _global__ void transpose_naive(float *odata, float *idata, int width, int height) |
思想:将大矩阵划分成方块,并且存储在SMEM里。不仅SMEM速度更快,而且每行元素个数变少,跨行访问的间距变小,局部性增强。而且对于大矩阵加速效果会更明显。
1 | __global__ void transpose(float *odata, float *idata, int width, int height) |
when Block/tile dimensions are multiples of 16 ???
https://developer.nvidia.com/blog/efficient-matrix-transpose-cuda-cc/
对于一个32 × 32个元素的共享内存块,一列数据中的所有元素都映射到相同的SMEM bank ,导致bank conflict 的最坏情况:读取一列数据会导致32路的存储库冲突。
幸运的是,只需要将tile的元素宽度改为33,而不是32就行。
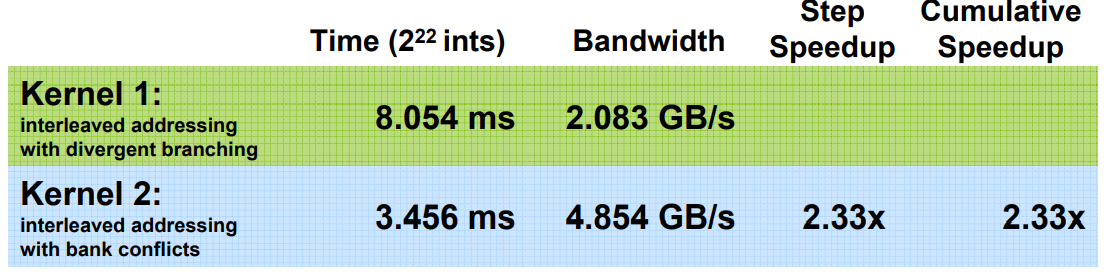
具体问题:将长数组的所有元素,归约求和为一个结果。[^1][^2]
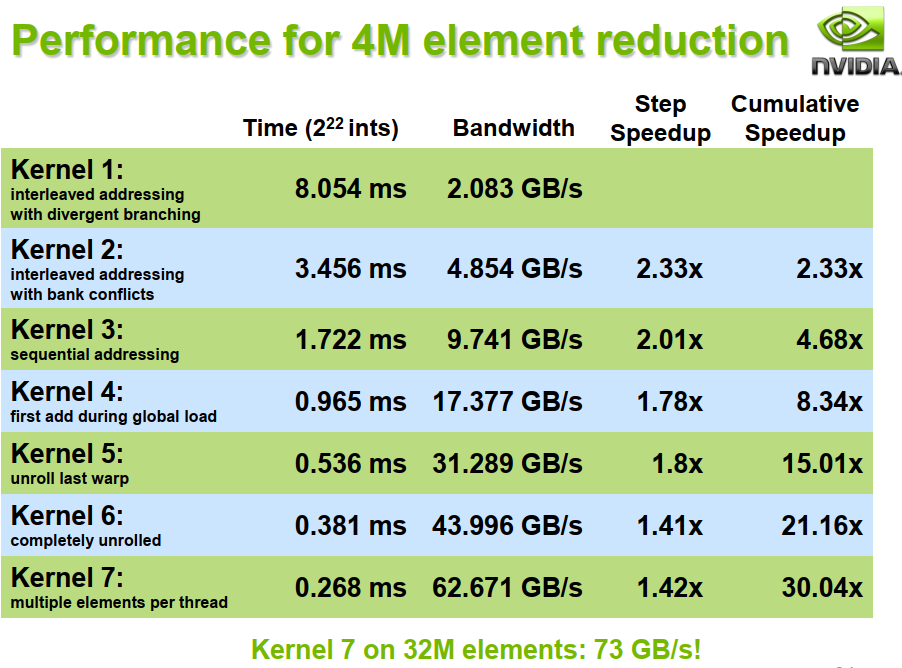
为了避免全局同步的巨大开销,采取分级归约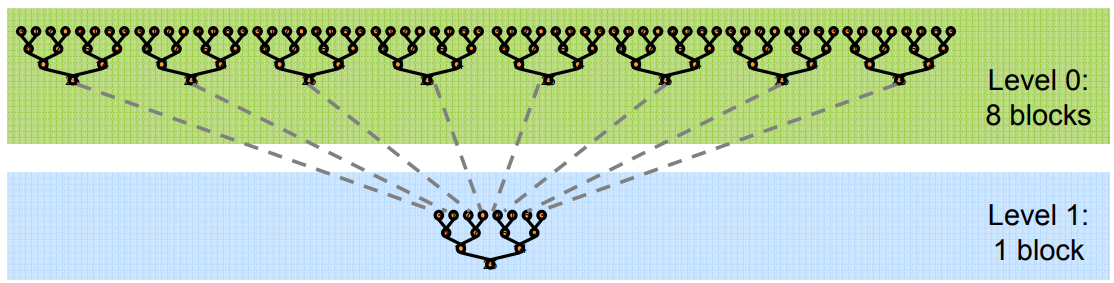
由于归约的计算密度低
1 flop per element loaded (bandwidth-optimal)
所以优化目标是将访存带宽用满。
1 | 384-bit memory interface, 900 MHz DDR |
1 | __global__ void reduce0(int *g_idata, int *g_odata) { |
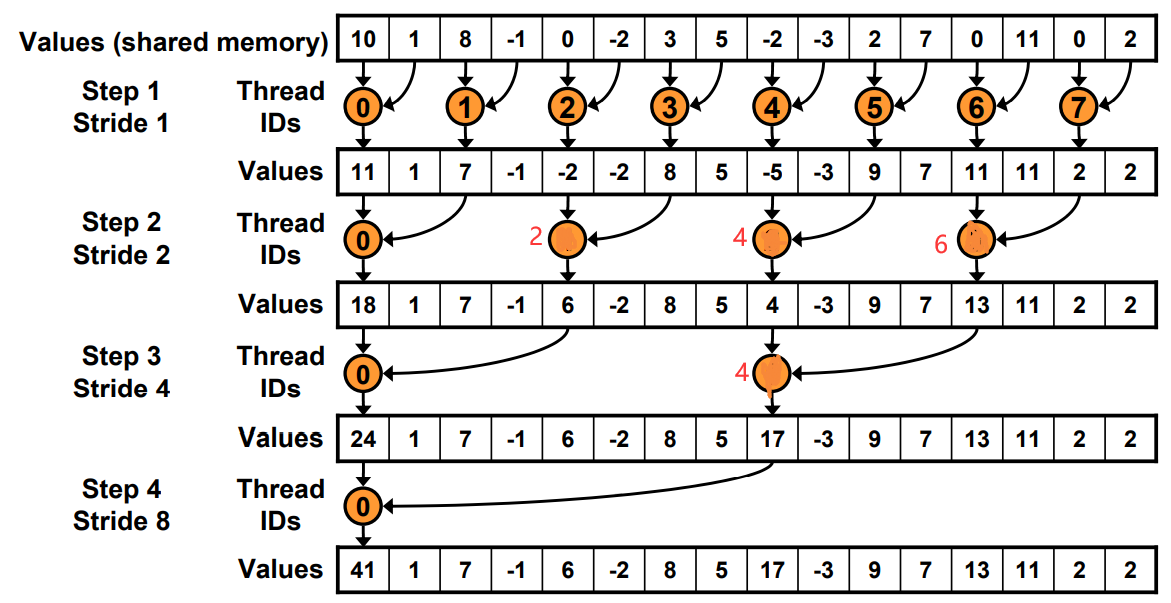
工作的线程越来越少。一开始是全部,最后一次只有thread0.
Just replace divergent branch With strided index and non-divergent branch,但是会带来bank conflict。
原理和Warp发射有关,假如在这里每个Warp并行的线程是2。一个Warp运行耗时为T.
Step0: 4+4+2+1=11T
Step1: 4+2+1+1=8T
1 | for (unsigned int s=1; s < blockDim.x; s *= 2) { |
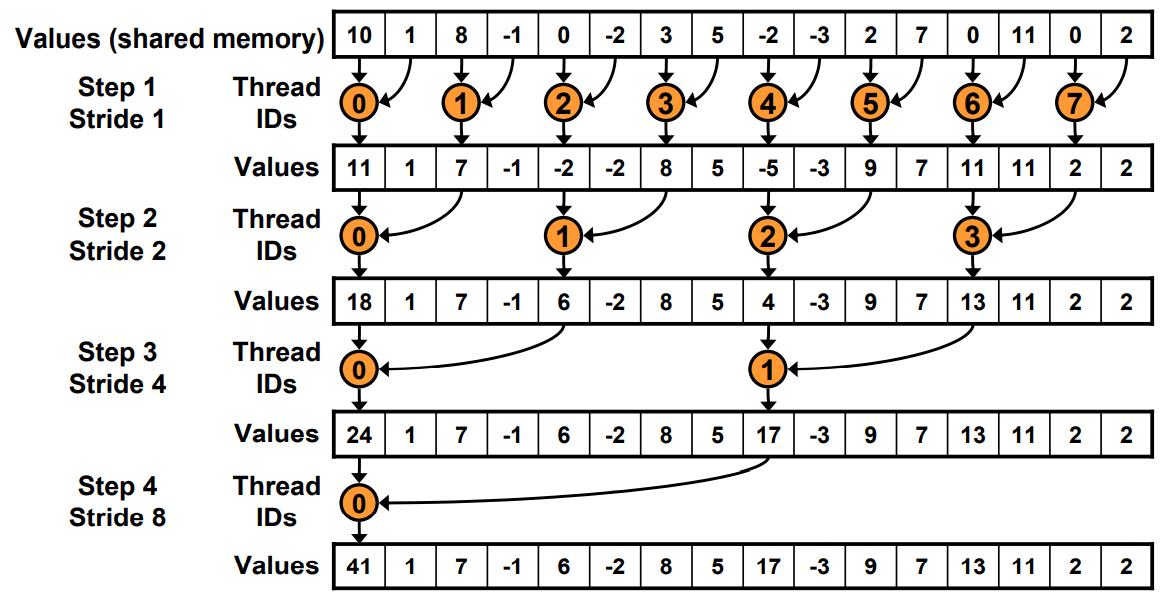
1 | for (unsigned int s=blockDim.x/2; s>0; s>>=1) { |
原本寻址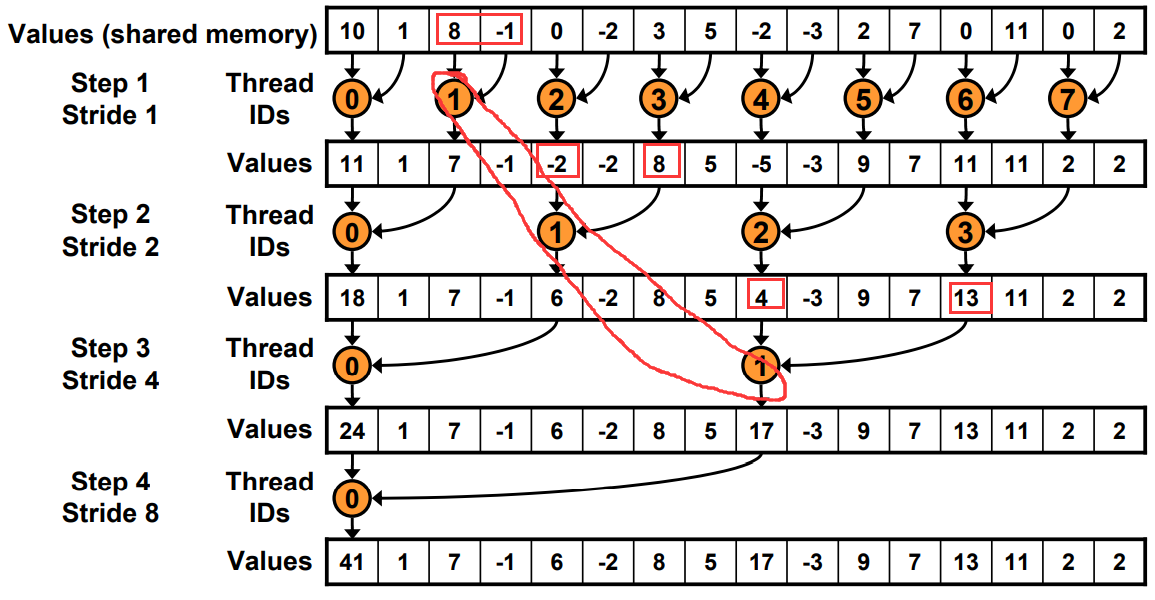
现在寻址有一边连续了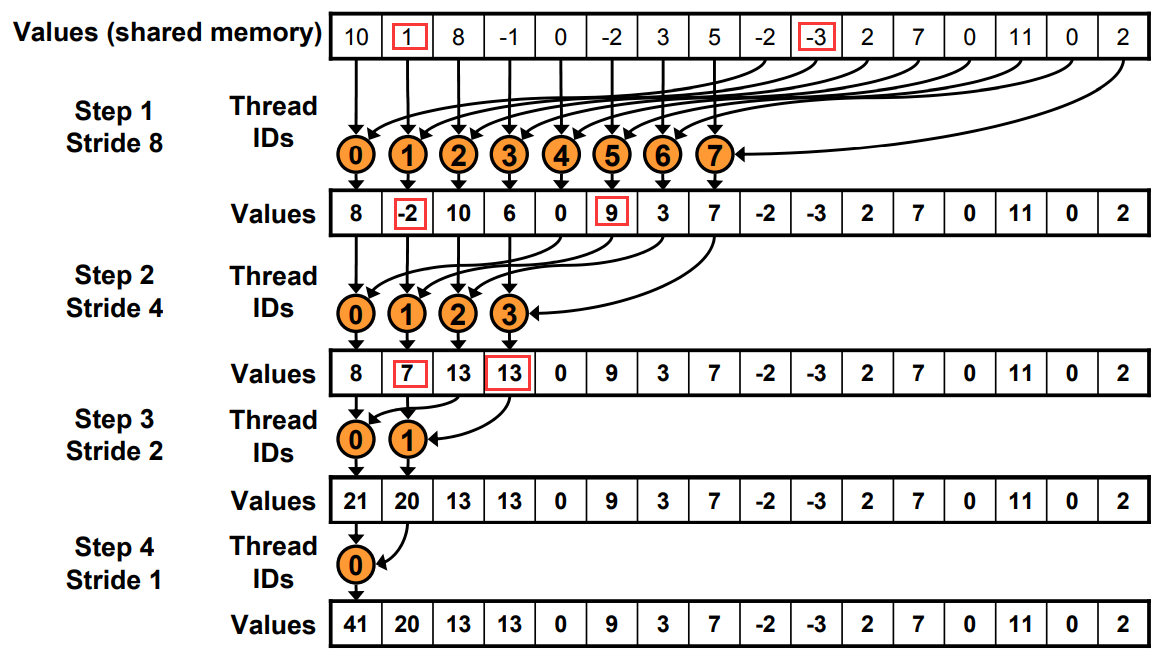
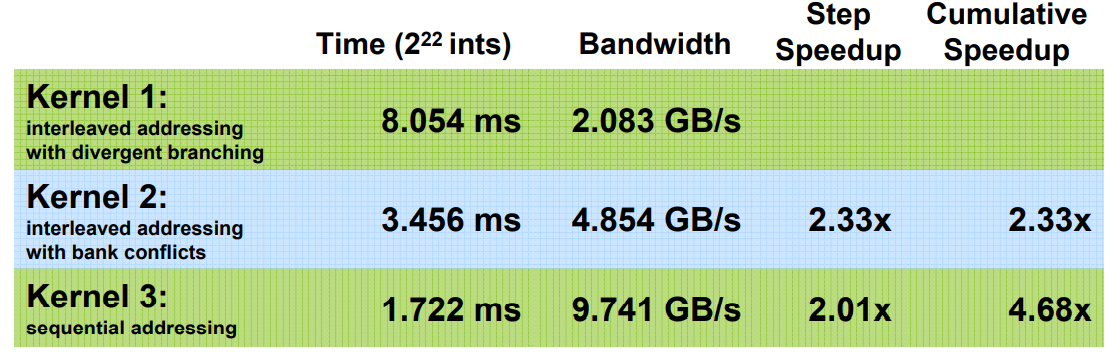
方法: 在load SMEM的时候提前做一次规约加法,通过减少一半的block数,将原本两个block里的值load+add存储在sum里。
1 | // perform first level of reduction, |

当s< 32的时候,就只有一个Warp工作了。
使用warp的SIMD还省去了__syncthreads()的麻烦
1 | for (unsigned int s=blockDim.x/2; s>32; s>>=1) |
为了保持整洁,最后一个if还做了无效的计算。eg, Warp里的最后一个线程只有第一句命令有用。
由于for循环里是二分的,而且小于32的单独处理了,导致for循环里实际运行代码最多就3句。
利用代码模板和编译器的自动优化实现:
1 | template <unsigned int blockSize> |
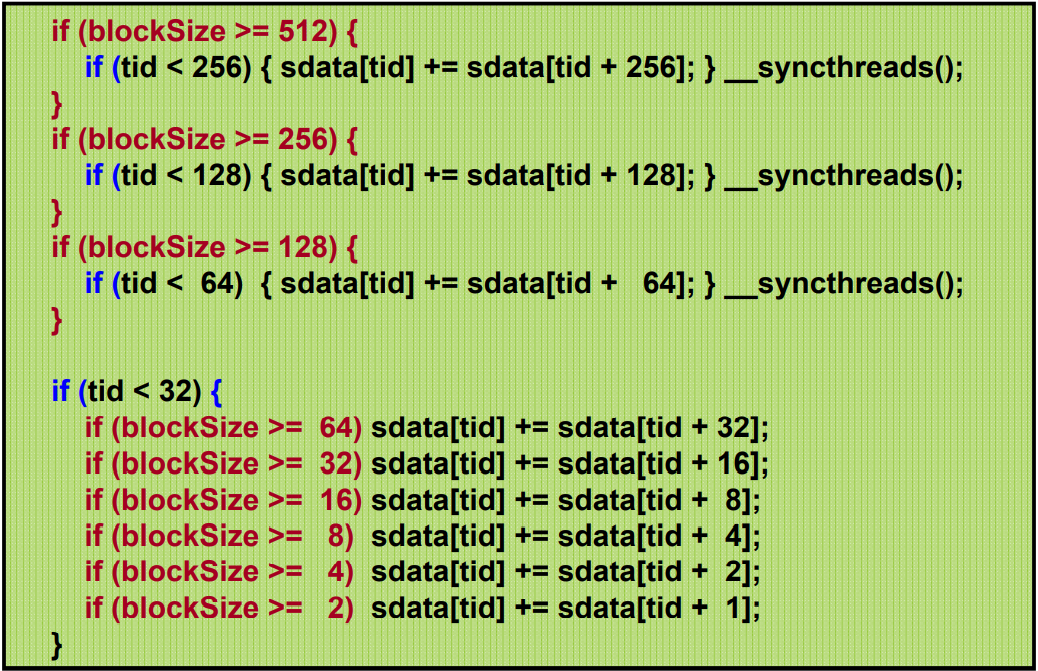
红色代码会在编译时自动优化。
加速级联??
Cost= processors × time complexity
我们知道N个元素直接二叉树归约是O(log N)
时间 Cost=N*O(log N).
但是假如只有P个线程先做N/P的串行加法, 然后是log(P)的归约。
总cost=P(N/P+log(P))
当P=N/log(N), cost=O(N)
each thread should sum O(log n) elements来设置
比如,1024 or 2048 elements per block vs. 256 线程。每个sum n=4个元素。 具体参数要perf
1 | unsigned int tid = threadIdx.x; |
1 | template <unsigned int blockSize> |
有if语句是没问题的,只要运行的时候全部执行if或者else就行。不要有些执行if,有些执行else,这才会等待。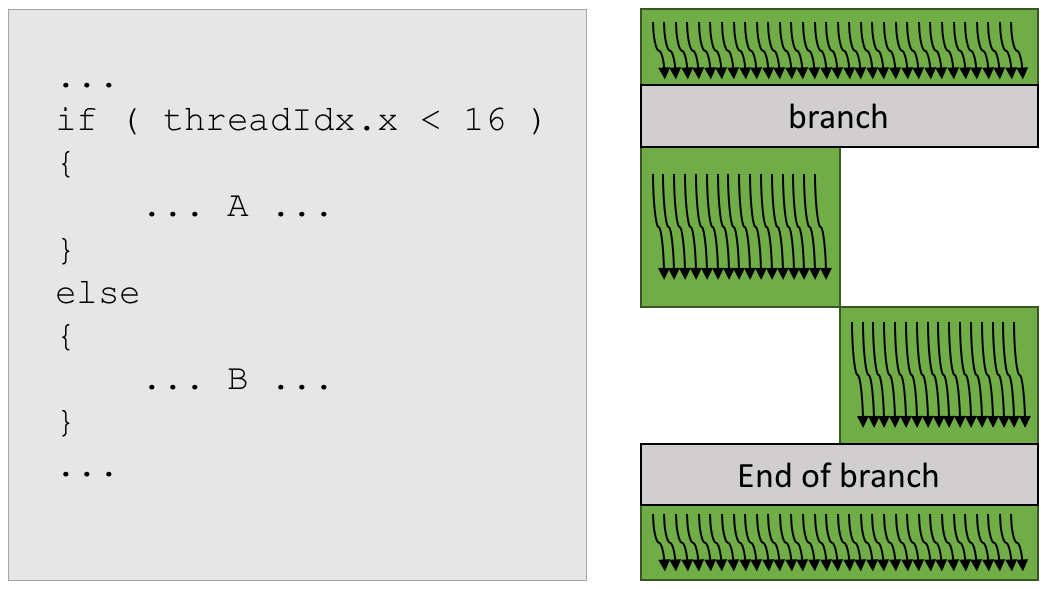
说不定也不是全部执行if或者else就行,只需要连续32个Thread Index,是相同的执行就行。(猜想,需要测试。
通过增加block里的线程数,并且同时读取来隐藏延迟。 不仅可以隐藏Global Memory的延迟,还可以隐藏写后读的延迟
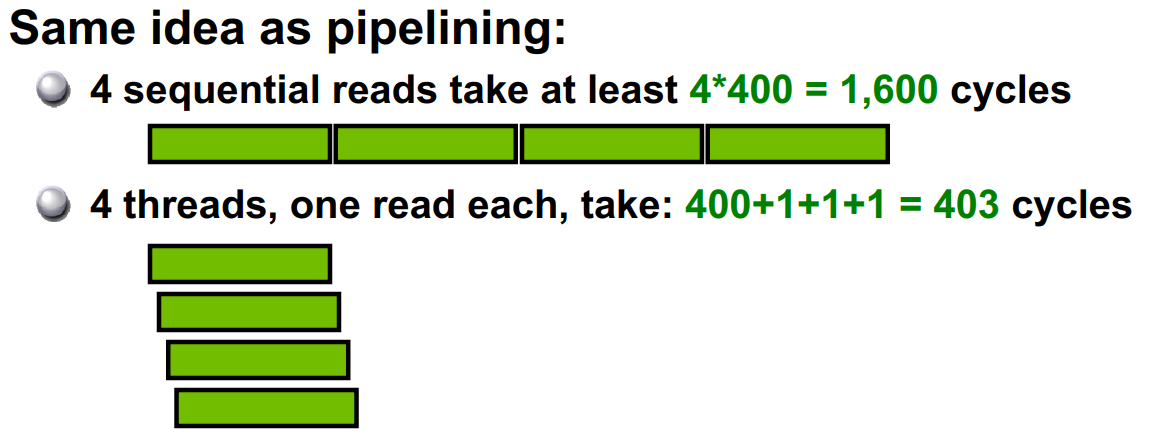
线程太多会导致分配到每一个的寄存器和SMEM变少
通过编译时加-cubin选项,.cubin文件前几行会显示
1 | architecture {sm_10} |
[^1]: SC07 Optimizing Parallel Reduction in CUDA - Mark Harris
[^2]: 2009 清华 邓仰东 cuda lecture pdf 注意也是参考的SC07 Nvidia。
1 | $ which nvprof |
命令行直接运行
1 | nvprof ./myApp |
1 | nvprof --print-gpu-trace ./myApp |
1 | sudo /usr/local/cuda/bin/nvprof --log-file a.log --metrics achieved_occupancy /staff/shaojiemike/github/cutests/22-commonstencil/common |
1 | nvprof --export-profile timeline.prof <app> <app args> |
1 | sudo /usr/local/cuda/bin/ncu -k stencil_kernel -s 0 -c 1 /staff/shaojiemike/github/cutests/22-commonstencil/best |
ncu-ui是可视化界面,但是没弄懂
1 | # shaojiemike @ snode0 in ~/github/cuda-samples-11.0 [16:02:08] $ ./bin/x86_64/linux/release/bandwidthTest [CUDA Bandwidth Test] - Starting... Running on... Device 0: Tesla P40 Quick Mode Host to Device Bandwidth, 1 Device(s) PINNED Memory Transfers Transfer Size (Bytes) Bandwidth(GB/s) 32000000 11.8 Device to Host Bandwidth, 1 Device(s) PINNED Memory Transfers Transfer Size (Bytes) Bandwidth(GB/s) 32000000 13.0 Device to Device Bandwidth, 1 Device(s) PINNED Memory Transfers Transfer Size (Bytes) Bandwidth(GB/s) 32000000 244.3 Result = PASS NOTE: The CUDA Samples are not meant for performance measurements. Results may vary when GPU Boost is enabled. # shaojiemike @ snode0 in ~/github/cuda-samples-11.0 [16:03:24] $ ./bin/x86_64/linux/release/p2pBandwidthLatencyTest |
nvprof通过指定与dram,L1或者L2 的metrics来实现。具体解释可以参考官网
在 Maxwell 和之后的架构中 L1 和 SMEM 合并
| Metric Name | 解释 |
|---|---|
| achieved_occupancy | 活跃cycle是 Warps 活跃的比例 |
| dram_read_throughput | |
| dram_utilization | 在0到10的范围内,相对于峰值利用率,设备内存的利用率水平 |
| shared_load_throughput | |
| shared_utilization | |
| l2_utilization |
暂无
暂无