Introduction
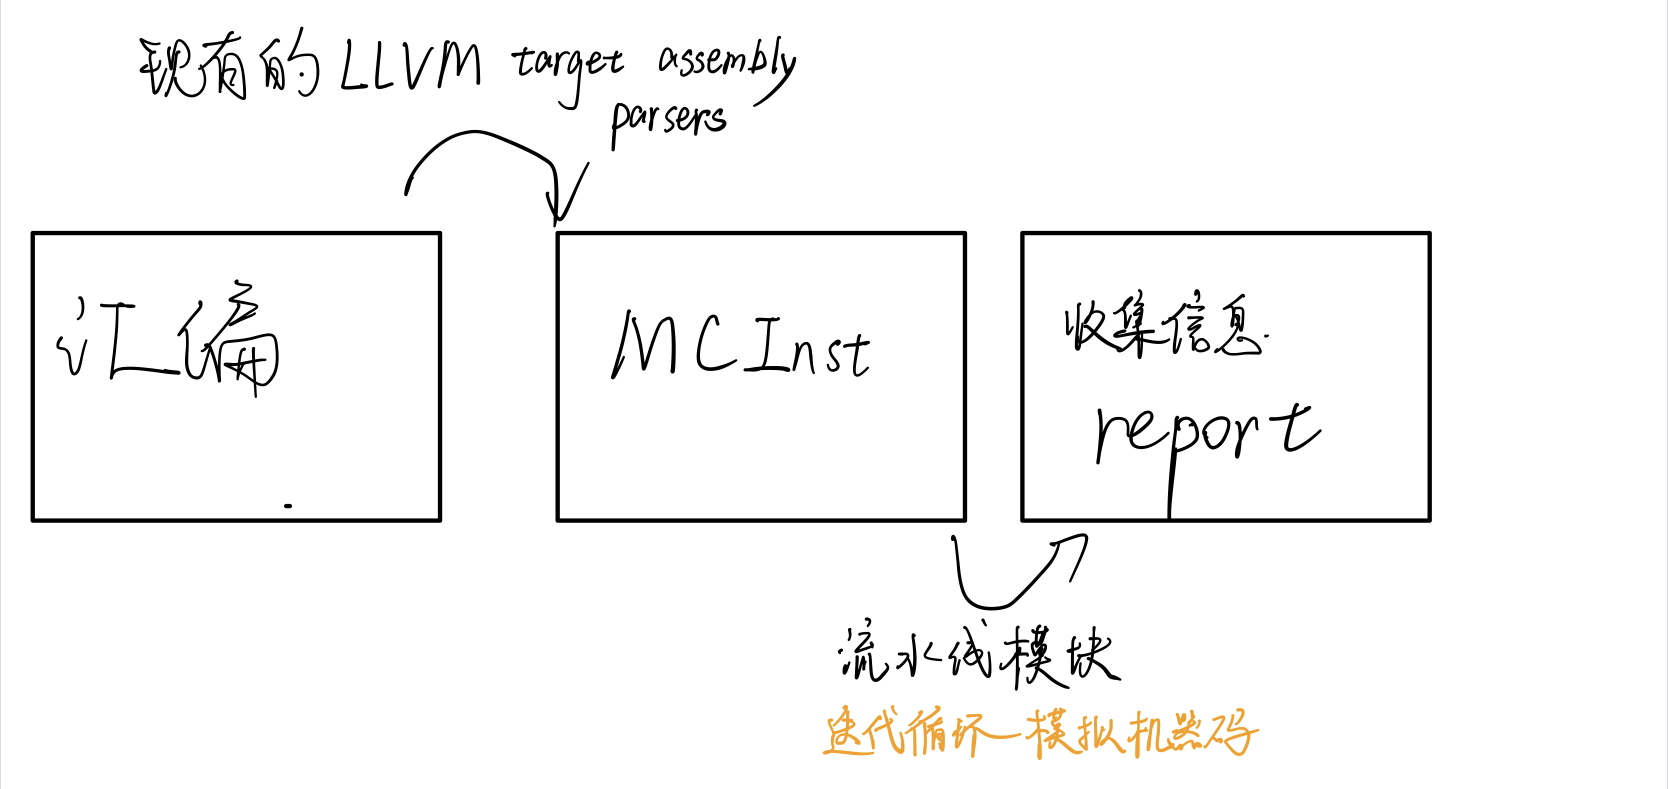
LLVM Machine Code Analyzer 是一种性能分析工具,它使用llvm中可用的信息(如调度模型)静态测量特定CPU中机器代码的性能。
性能是根据吞吐量和处理器资源消耗来衡量的。该工具目前适用于在后端中使用LLVM调度模型的处理器。
该工具的主要目标不仅是预测代码在目标上运行时的性能,还帮助诊断潜在的性能问题。
给定汇编代码,llvm-mca可以估计每个周期的指令数(IPC)以及硬件资源压力。分析和报告风格的灵感来自英特尔的IACA工具。
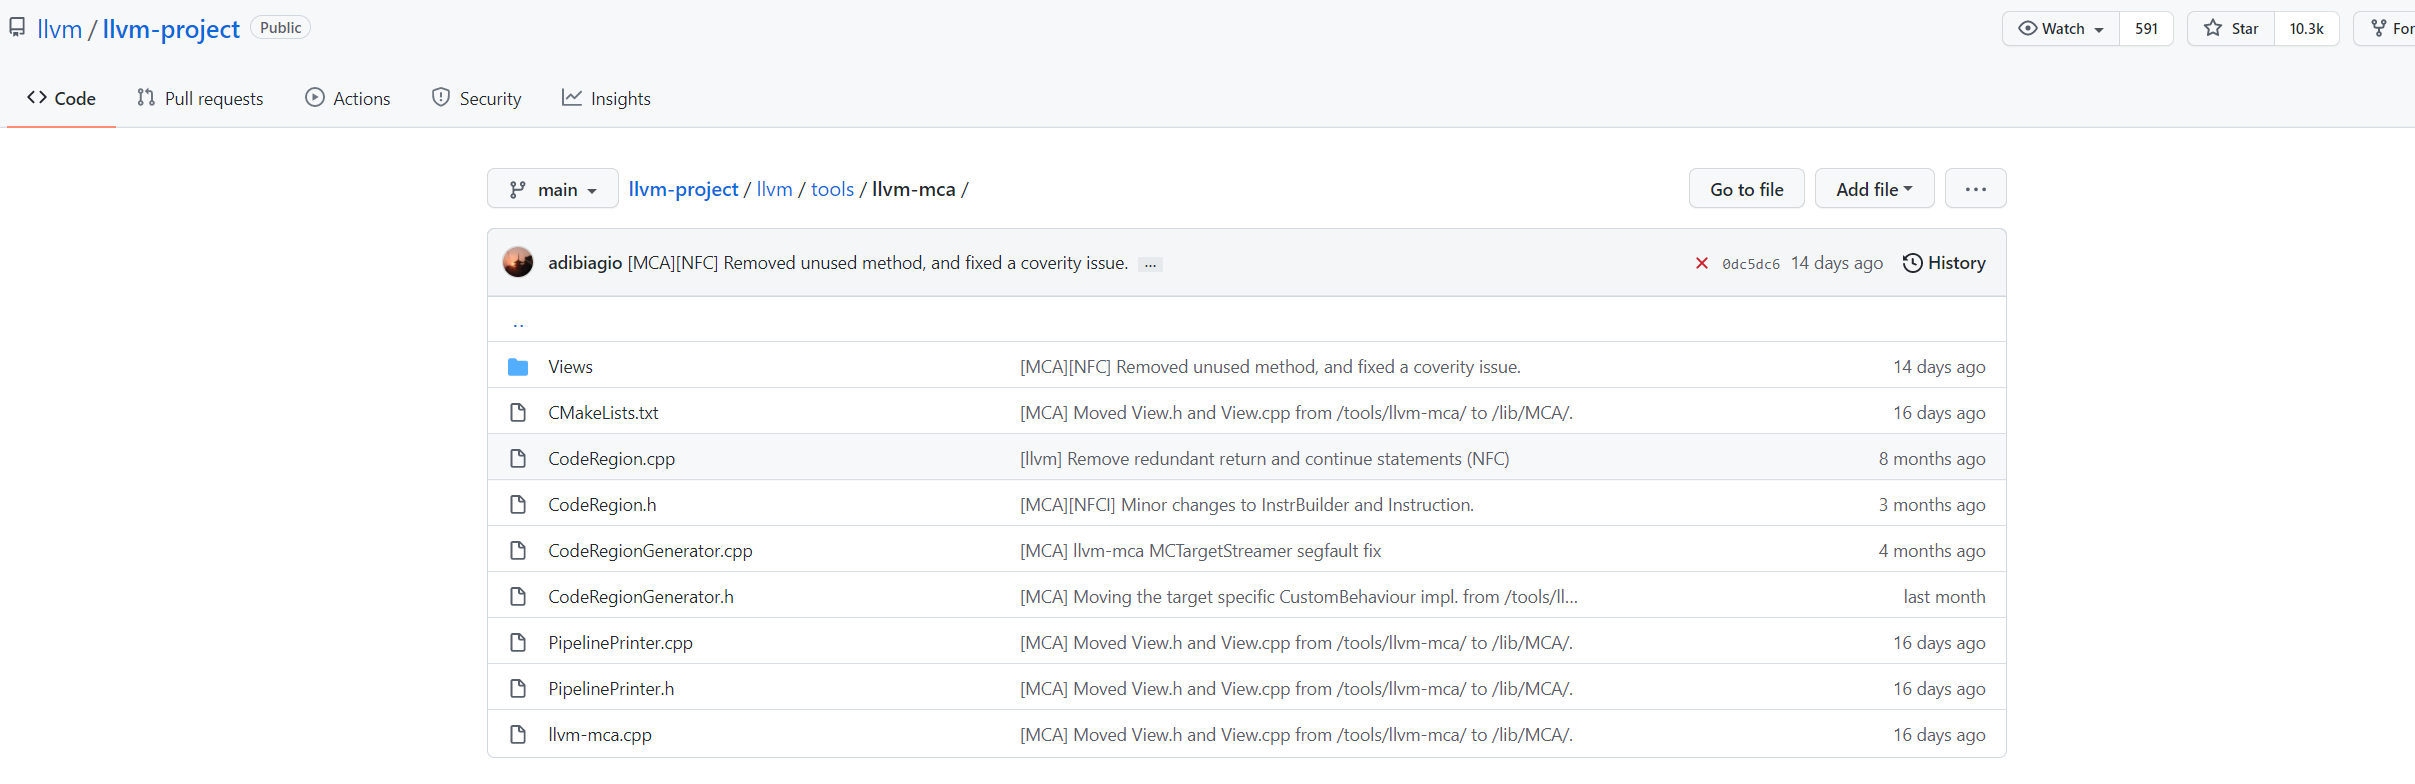
github
https://github.com/llvm/llvm-project/tree/main/llvm/tools/llvm-mca
docs
https://llvm.org/docs/CommandGuide/llvm-mca.html
options
architecture
1 | -mtriple=<target triple> |
1 | # 查看支持的arch |
output-report
1 | -output-asm-variant=<variant id> |
runtime options
1 | -dispatch=<width> |
more values/Info
1 | -resource-pressure |
实现逻辑
样例分析
quick overview of the performance throughput
1 | Iterations: 300 |
- IPC
- 理论最大值是$$\frac{OneLoopInstructions}{Block_RThroughput}=(OneLoopInstructions)*(Block_Throughput)$$
- uOps Per Cycle
- simulated micro opcodes (uOps)
- 每个周期的simulated micro opcodes数
- 在不考虑循环依赖的情况下,理论上最大值是$$\frac{OneLoopUOps}{Block_RThroughput}=(OneLoopUOps)*(Block_Throughput)$$
- A delta between Dispatch Width and this field is an indicator of a performance issue.
- The delta between the Dispatch Width (2.00), and the theoretical maximum uOp throughput (1.50) is an indicator of a performance bottleneck caused by the lack of hardware resources, and the Resource pressure view can help to identify the problematic resource usage.
- Dispatch Width
- 发射到乱序后端的最大微指令操作数(the maximum number of micro opcodes/uOps)?
- Block RThroughput (Block Reciprocal Throughput)
- 在不考虑循环依赖的情况下,理论上的每次循环的最大block或者iterations数
- 受限于dispatch rate和the availability of hardware resources.
Instruction info view
1 | Instruction Info: |
显示了指令里队列每条指令的延迟和吞吐量的倒数。
RThroughput是指令吞吐量的倒数。在不考虑循环依赖的情况下,吞吐量是单周期能执行的同类型指令的最大数量。
Resource pressure view
1 | Resources: |
每次循环或者每条指令执行,消耗的资源周期数。从而找到高资源占用的部分。
Timeline View
可打印流水线情况
1 | Timeline view: |
影响因素包括:
- 数据冲突/依赖:读后写,写后读依赖 。无法指令级并行,也可以通过寄存器重命名解决
- 结构冲突:占用发射位 或者 同一硬件
- 控制冲突:分支?
- instructions must retire in program order, so [1,0] has to wait for [0,2] to be retired first
Bottleneck Analysis
- 可以分析出数据冲突/依赖和结构冲突的影响大小
- 准确性取决于模拟和是否有对应CPU模型。
- 暂时不支持有序后端。
1 | Cycles with backend pressure increase [ 91.52% ] |
- 端口信息来自TableGen
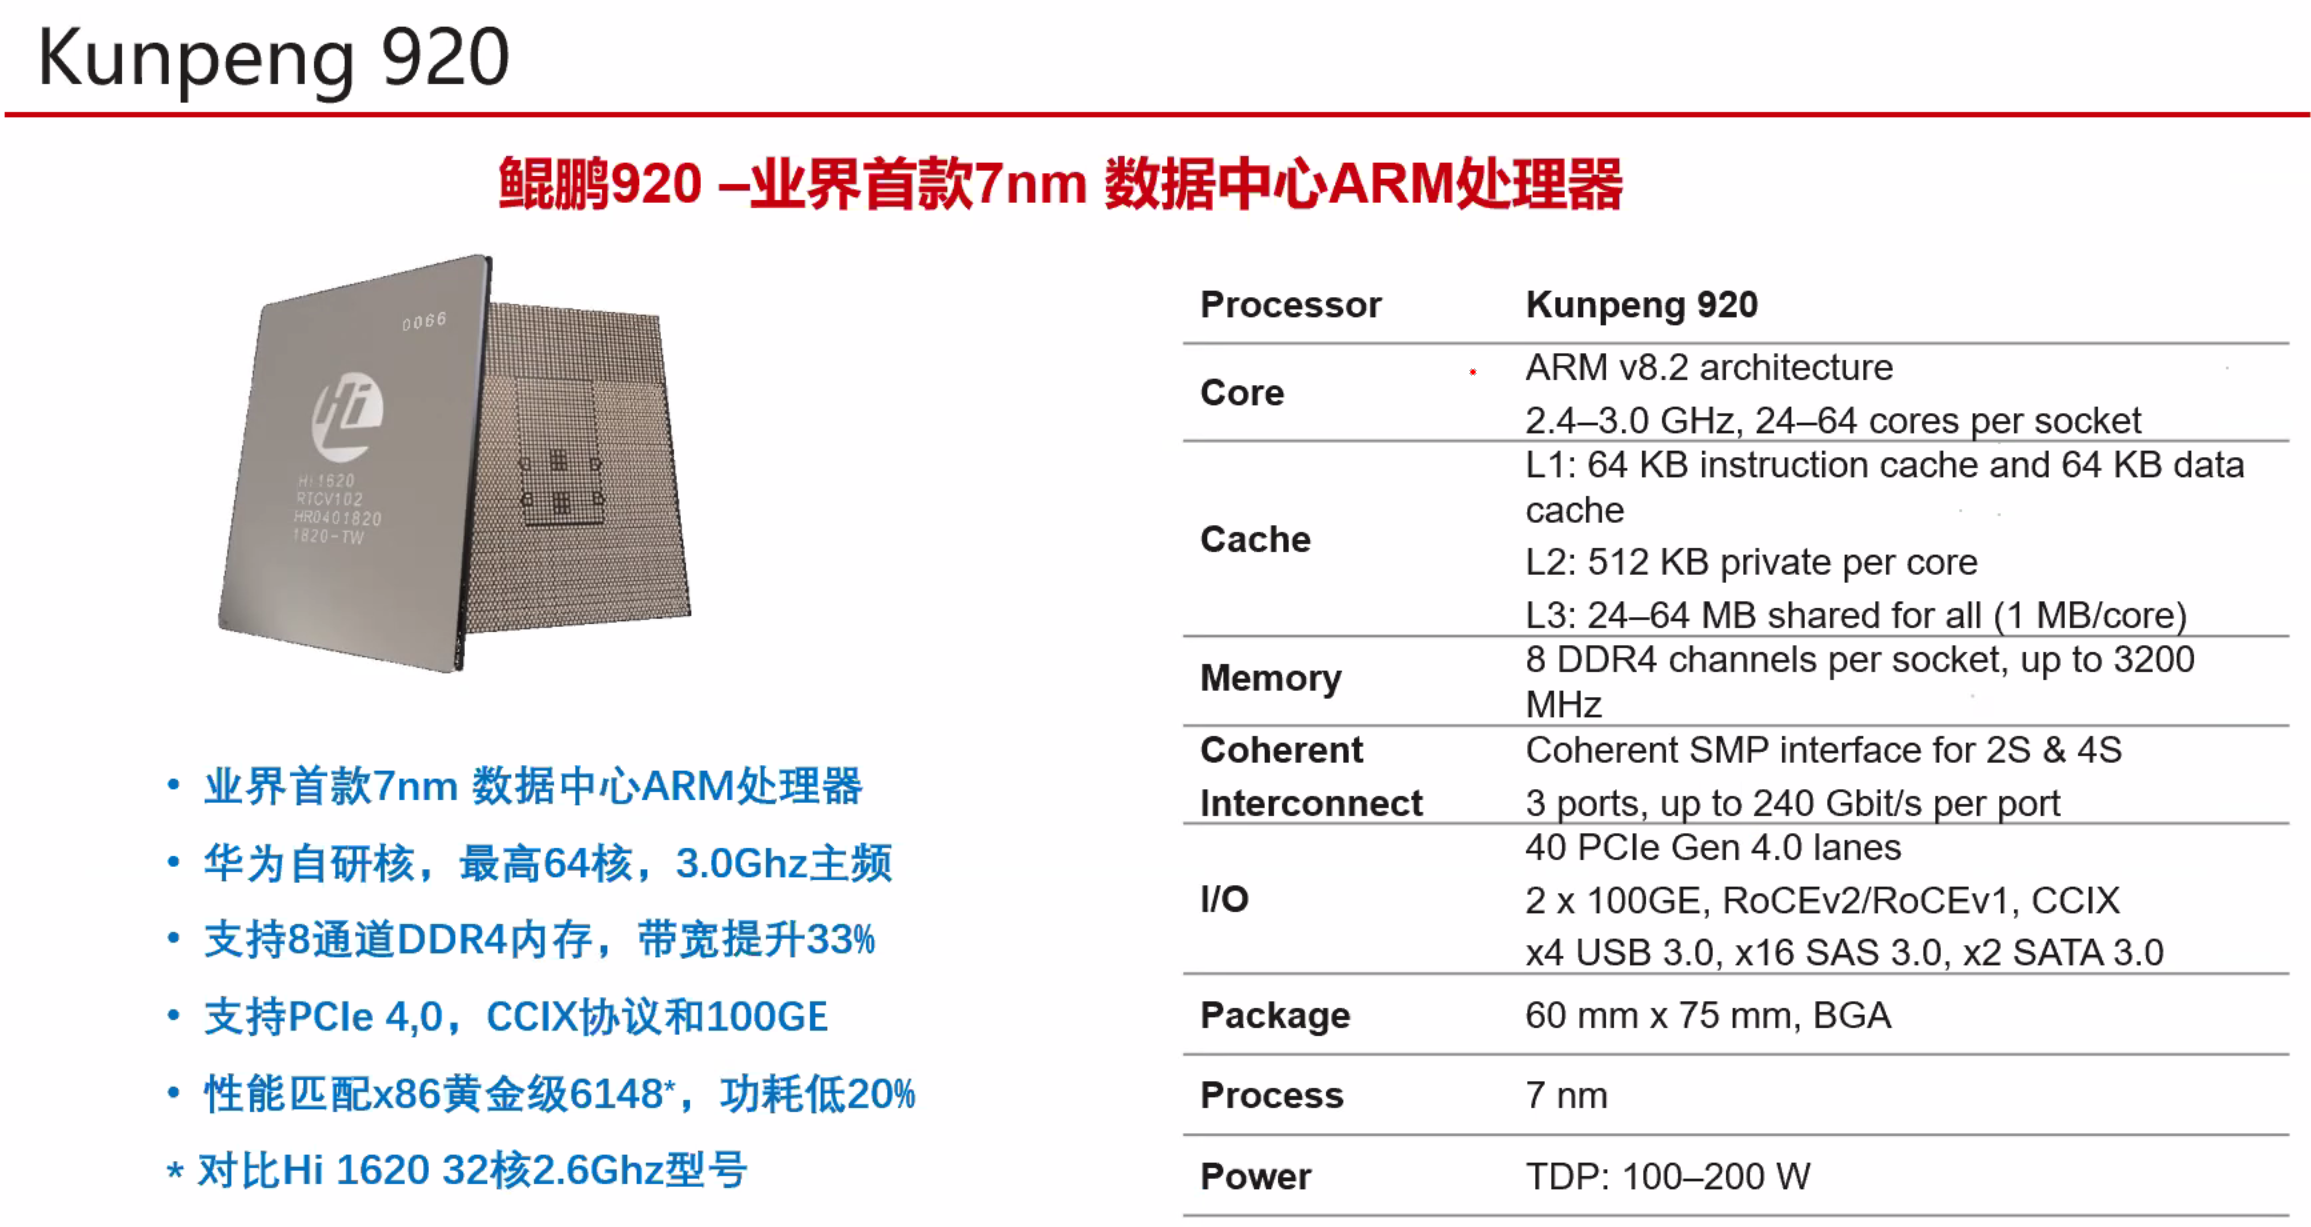
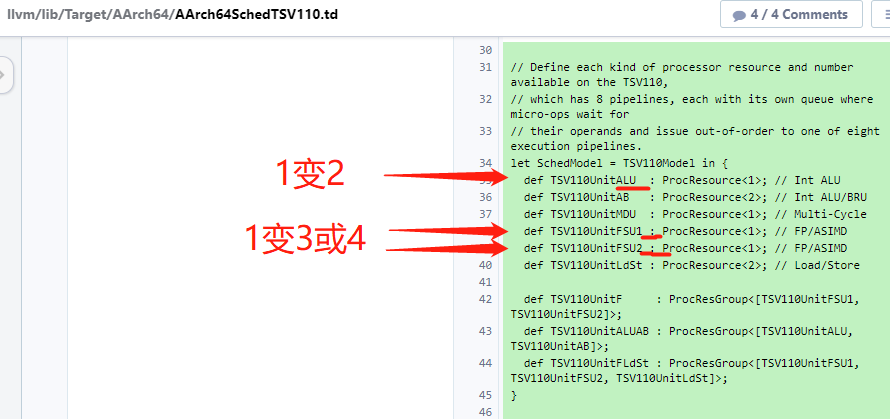
llvm/lib/Target/X86/X86SchedSandyBridge.td - 鲲鹏920的来自
llvm/lib/Target/AArch64/AArch64SchedTSV110.td
额外信息
- Dynamic Dispatch Stall Cycles
- Dispatch Logic
- 可以看出流水线发射满带宽或几条指令的时间占比
- Schedulers
- 每个周期微指令发射数占比
- Scheduler’s queue usage
执行时使用的平均或最大buffer entries (i.e., scheduler queue entries)
AMD Jaguar
JALU01 - A scheduler for ALU instructions. JFPU01 - A scheduler floating point operations. JLSAGU - A scheduler for address generation.register-file-stats -dispatch-stats -scheduler-stats -retire-stats -instruction-info instruction-tables1
2
3
4
5
6
7
8
9
10
11
12
13
14
15
16
17
18
19
20
21
22
23
24
25
26
27
28
29
30
31
32
33
34
35
36
37
38
39
40
41
42
43
44
45
46
47
48
49
50
51
52
53
54
55
56
57
58
59
60
61
62
63
64
65
66
67
68
69
70
71
72
73
74
75
76
77
78
79
80
81
82
83
84
85
86
87
88
89
90
91
92
93
94
95
96
97
98
99
100
101
102
103
104
105
106
107
108
109
110
111
112
113
114
115
116
117
5. Retire Control Unit
1. 在一个周期里有多少指令retired的占比(好吧,感觉有语病)
6. A re-order buffer (ROB) 的使用情况
7. Register File statistics
1. physical register file (PRF)
2. floating-point registers (JFpuPRF)
3. integer registers (JIntegerPRF)
## Instruction Flow
llvm-mca 假设指令在模拟开始之前已经全部解码并放入队列中。因此,指令提取和解码阶段没有被计算。未考虑前端的性能瓶颈。此外,llvm-mca 不模拟分支预测。
### Instruction Dispatch
处理器的默认 dispatch width值等于LLVM’s scheduling model里的IssueWidth值。
An instruction can be dispatched if:
* The size of the **dispatch group** is smaller than processor’s dispatch width.
* There are enough entries in the **reorder buffer**.
* There are enough **physical registers** to do register renaming.
* The schedulers are **not full**.
reorder buffer负责跟踪命令,使之按照程序顺序retired结束。其默认值为 MicroOpBufferSize 。
各种Buffered resources 被视作scheduler resources.
### Instruction Issue
每个处理器调度器实现一个指令缓冲区。指令必须在调度程序的缓冲区中等待,直到输入寄存器操作数可用。只有在那个时候,指令才符合执行的条件,并且可能会被发出(可能是乱序的)以供执行。 llvm-mca 在调度模型的帮助下计算指令延迟。
llvm-mca 的调度器旨在模拟多处理器调度器。调度器负责跟踪数据依赖关系,并动态选择指令消耗哪些处理器资源。它将处理器资源单元和资源组的管理委托给资源管理器。资源管理器负责选择指令消耗的资源单元。例如,如果一条指令消耗了一个资源组的1cy,则资源管理器从该组中选择一个可用单元;默认情况下,资源管理器使用循环选择器来保证资源使用在组的所有单元之间均匀分配。
llvm-mca’s scheduler internally groups instructions into three sets:
* WaitSet: a set of instructions whose operands are not ready.
* ReadySet: a set of instructions ready to execute.
* IssuedSet: a set of instructions executing.
### Write-Back and Retire Stage
retire control unit
1. When instructions are executed,the flags the instruction as “ready to retire.”
2. Instructions are retired in program order
3. free the physical registers
### Load/Store Unit and Memory Consistency Model
load/store unit (LSUnit)用来模拟乱序memory操作
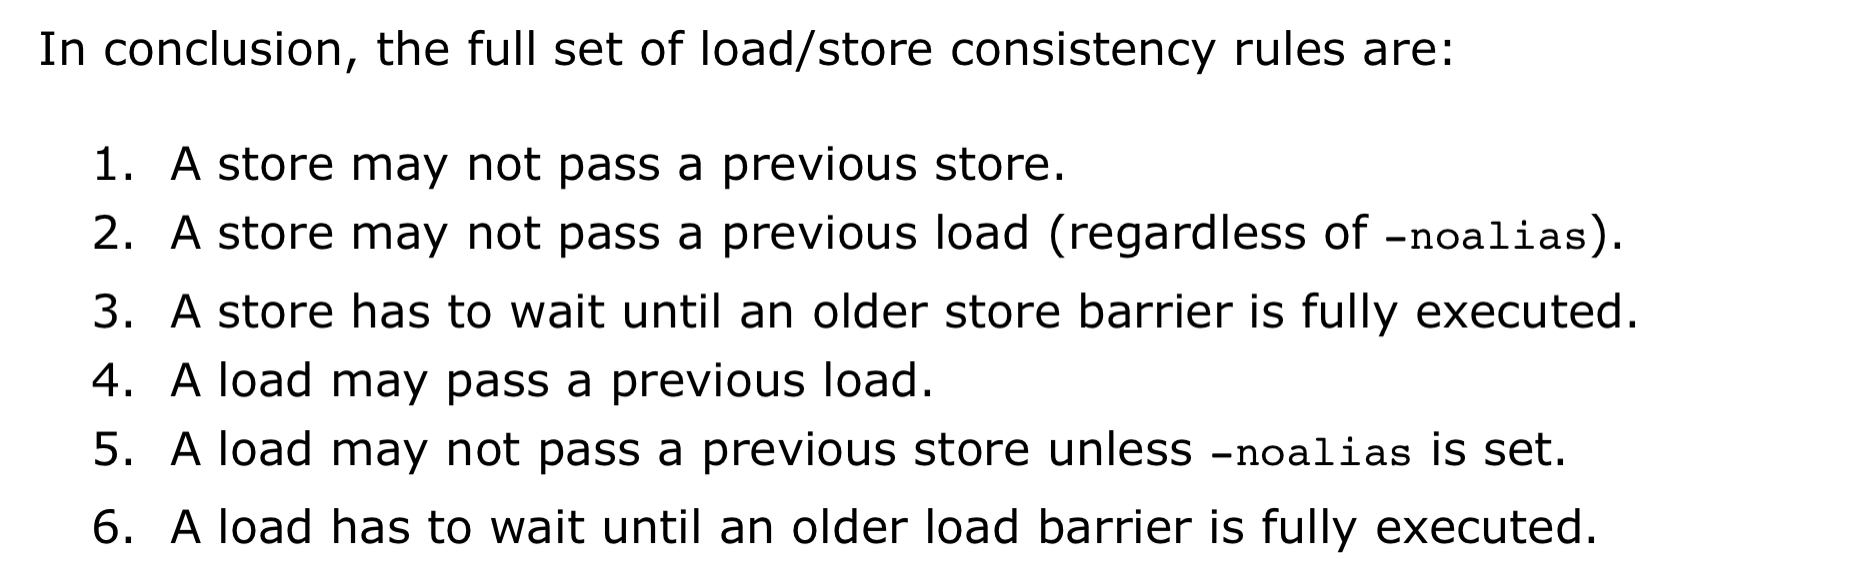
The rules are:
1. A younger load is allowed to pass an older load only if there are no intervening stores or barriers between the two loads.
2. A younger load is allowed to pass an older store provided that the load does not alias with the store.
3. A younger store is not allowed to pass an older store.不能交换顺序的意思
4. A younger store is not allowed to pass an older load.
假设 loads do not alias (-noalias=true) store operations.Under this assumption, younger loads are always allowed to pass older stores. ???
LSUnit不打算跑alias analysis来预测何时load与store不相互alias???
in the case of write-combining memory, rule 3 could be relaxed to allow reordering of non-aliasing store operations.???
LSUnit不管的其余三点:
1. The LSUnit does not know when store-to-load forwarding may occur.
2. The LSUnit does not know anything about cache hierarchy and memory types.
3. The LSUnit does not know how to identify serializing operations and memory fences.
4. The LSUnit does not attempt to predict if a load or store hits or misses the L1 cache(不考虑cache命中,默认是命中L1,产生the load-to-use latency的最乐观开销)
llvm-mca 不知道序列化操作或内存屏障之类的指令。 LSUnit 保守地假设同时具有“MayLoad”和未建模副作用的指令的行为类似于“软”load-barrier。这意味着,它在不强制刷新load队列的情况下序列化加载。类似地,“MayStore”和具有未建模副作用的指令被视为store障碍。完整的memory-barrier是具有未建模副作用的“MayLoad”和“MayStore”指令。LLVM的实现是不准确的,但这是我们目前使用 LLVM 中可用的当前信息所能做的最好的事情。
load/store barrier会占用在load/store 队列里占用一项。
当load/store barrier是其队列里oldest项时,其会被执行
### In-order Issue and Execute
有序处理器被建模为单个 InOrderIssueStage 阶段。它绕过 Dispatch、Scheduler 和 Load/Store 单元。一旦它们的操作数寄存器可用并且满足资源要求,就会发出指令。根据LLVM的调度模型中IssueWidth参数的值,可以在一个周期内发出多条指令。一旦发出,指令就会被移到 IssuedInst 集,直到它准备好retire。 llvm-mca 确保按顺序提交写入。但是,如果 RetireOOO 属性for at least one of its writes为真,则允许指令提交写入并无序retire???
## Custom Behaviour 自定义行为
某些指令在该模型中并不能被准确的模拟。为了几条指令而修改模型不是个好的选择,一般通过**CustomBehaviour**类对某些指令进行特殊建模:自定义数据依赖,以及规避、单独处理特殊情况。
为此,llvm-mca设置了一个通用的以及多个特殊的**CustomBehaviour**类。下面两种情况下会使用通用类:
1. 开启了`-disable-cb`选项
2. 不存在针对某目标的特殊类(通用类也做不了什么,我什么也做不到😥)
但是注意目前只有in-order流水线实现了**CustomBehaviour**类,out-order流水线将来也会支持。
该类主要通过`checkCustomHazard()`函数来实现,通过当前指令和真正流水线中执行的指令,来判断当前指令需要等待几个周期才能发射。
如果想对没有实现的目标添加**CustomBehaviour**类,可以参考已有的实现,比如在`/llvm/lib/Target/AMDGPU/MCA/`目录下。
## Custom Views 自定义视图
关于自定义的视图的添加路径,如果**没有输出**从未在MC layer classes (MCSubtargetInfo, MCInstrInfo, etc.)里出现过的**新后端值**,请把实现加入`/tools/llvm-mca/View/`。相反,请加入`/lib/Target/<TargetName>/MCA/`目录。
关于Custom Views所需内容,需要写特殊的**CustomBehaviour**类来覆写`CustomBehaviour::getViews()`函数,根据位置的不同还有三种实现`getStartViews(), getPostInstrInfoViews(),getEndViews()`。
## 影响准确性的因素
调度模型不仅用于计算指令延迟和吞吐量,还用于了解可用的处理器资源以及如何模拟它们。
llvm mca进行分析的质量不可避免地受到**llvm中调度模型质量**的影响。
## 功能(能估计的值
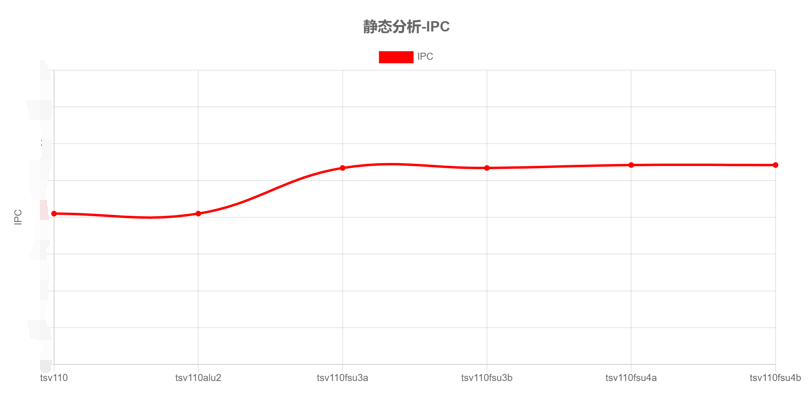
1. IPC
2. 硬件资源压力resource-pressure
3. 一些额外Info?
1.1
2
3
4
5
6
7
4. 吞吐量瓶颈?
### 支持对特定代码块的分析
1. 汇编代码,支持命名和嵌套
LLVM-MCA-BEGIN block-name
add %eax, %eax
LLVM-MCA-END
1
2
3
2. 高级语言,通过内联汇编实现int foo(int a, int b) {
__asm volatile(“# LLVM-MCA-BEGIN foo”);
a += 42;
__asm volatile(“# LLVM-MCA-END”);
a *= b;
return a;
}但是,这会干扰循环矢量化等优化,并可能对生成的代码产生影响。具体影响请对比汇编代码。
相关论文
Google学术搜llvm-mca,一堆论文。但是不急着看,因为没有预备知识,没有问题的去看论文。效率和收获很低的,而且会看不懂。
相关项目
mc-ruler
mc-ruler是整合了llvm-mca的cmake,可以打印指定部分的代码分析信息。如果之后要测试可能用得上。
需要进一步的研究学习
- 具体功能
- llvm如何实现的,要看代码。
遇到的问题
- (llvm-mca detects Intel syntax by the presence of an .intel_syntax directive at the beginning of the input. By default its output syntax matches that of its input.)
- ???的地方
- 大概看了一下功能,但是性能怎么对比呢。准确值是多少呢?
- arm kunpeng pmu-tools 实现
- 每次的估计值会波动吗?
如何和大神交流呢+提问的艺术


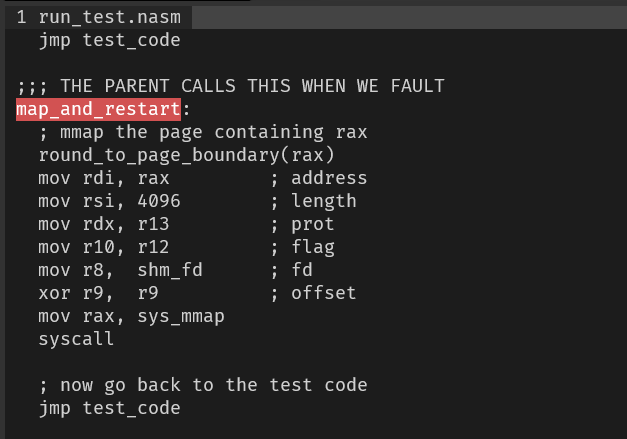
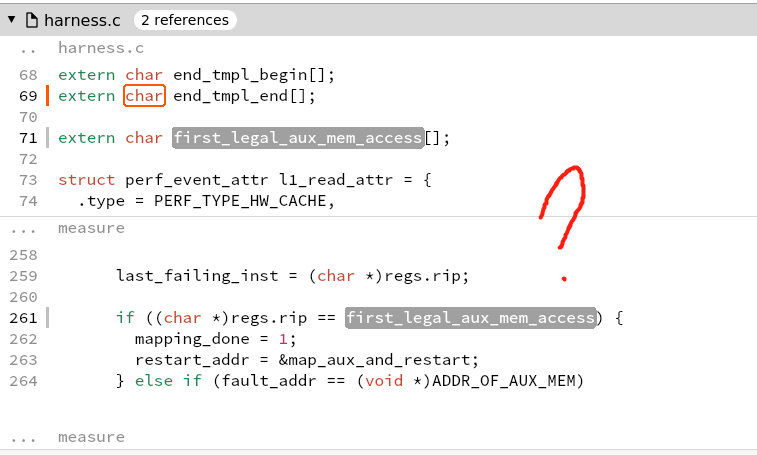
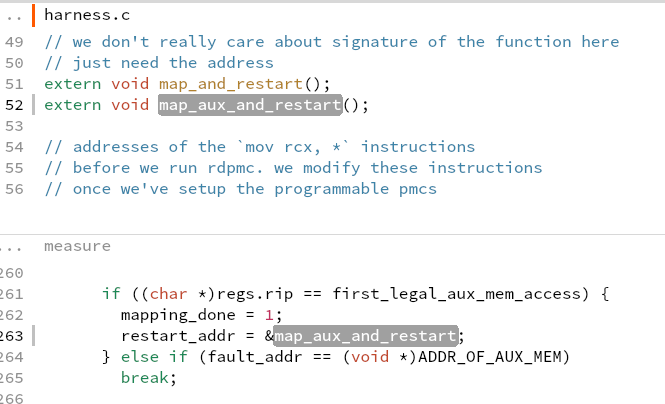 what is aux mem?