Debug/Profile/Devlop Tools of PTA
数据科学
matplotlib
基础语法与概念
plotly
matplotlib VS plotly
- matplotlib can use custom color and line style
- plotly is more easily to quickly built up.
基础语法与概念
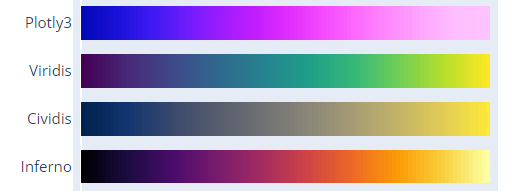
线性颜色柱的选择
https://plotly.com/python/builtin-colorscales/
same in matplotlib
plt.show 转发图像到本地
使用Dash: A web application framework for your data., 默认部署在localhost:8050端口
本地机器打通ssh隧道
1 | ssh -L 8050:127.0.0.1:8050 -vN -f -l shaojiemike 202.38.72.23 |
科研画图
In scientific research plotting, it’s always bar charts instead of line charts.
Possible reasons:
- The visual footprint of point lines is relatively small compared to bar
- Line charts are aggregated together when there is a meaningful comparison of data along the y-axis.
global setting
font things, Attention, global settings have higher priority to get work
1 |
|
layout
- picture size
1 |
- figure size (adjust x,y tick distance)
1 | # mpl |
- relative position
1 | # mpl: Adjust the left margin to make room for the legend, left & right chart vertical line position from [0,1] |
set x axis
1 | # mpl: |
set y axis
- vertical grid line
- dick size
- and range size
1 | # mpl |
Bolden Contour Lines
- Entire Figure
1 | # mpl ? |
- and Each Bar Within
1 | # mpl: Create a bar chart with bold outlines |
legend box
1 | # mpl: |
bar
1 | # mpl: white hugo hatch with black bar edge. |
Out-box text
To draw symmetry chart, we need to special highlight the overflow bar number.
If the ancher point locate in the plot box, it’s easy to show text above the ceil line using textposition="bottom" like option. In the opposite scenario, plotly and mathplotlib all will hide the out-box text.
1 | # plotly |
But mlb can write text out box.
1 | ax.text(1, -1.6, 'Increasing', ha="center") |
out-box line
mathplotlib(mpl) can achieve this using ref, but there are few blogs about plotly.
1 | # mpl: from 1*1 size full-graph (0.5,0.2) to point (1,0.8) |
in-box line
1 | # mpl: |
实践
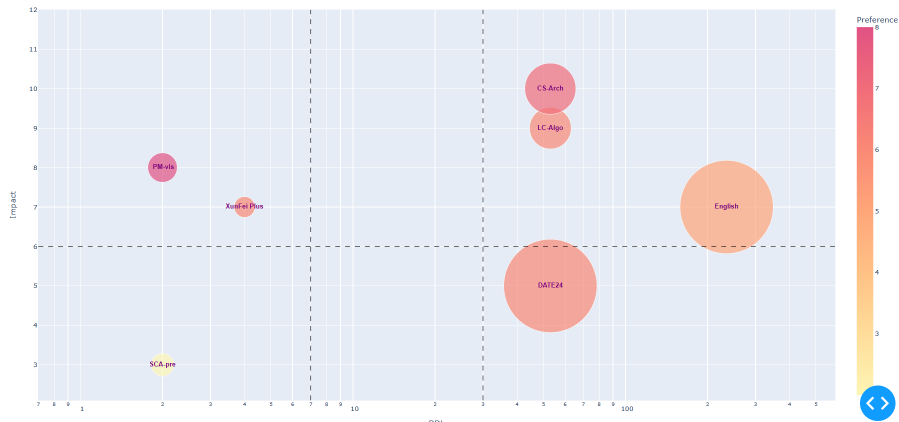
气泡图
二维无向图
3D图
如果防火墙是关闭的,你可以直接部署在external address上。使用docker也是可行的办法
1 | app.run_server(debug=True, host='202.38.72.23') |
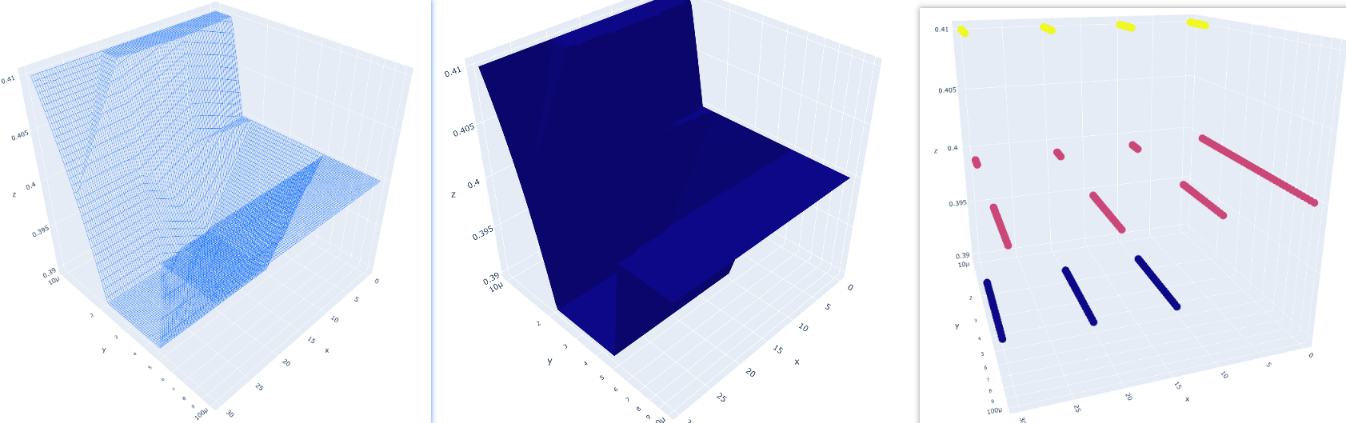
3D 散点图,拟合曲面与网格图
折线图
1 | import matplotlib.pyplot as plt |
Heatmap
Stacked Bar & grouped compare bar

Error Bars
在柱状图中,用于表示上下浮动的元素通常被称为“误差条”(Error Bars)。误差条是用于显示数据点或柱状图中的不确定性或误差范围的线条或线段。它们在柱状图中以垂直方向延伸,可以显示上下浮动的范围,提供了一种可视化的方式来表示数据的变化或不确定性。误差条通常通过标准差、标准误差、置信区间或其他统计指标来计算和表示数据的浮动范围。
Errorbars + StackedBars stacked 的过程中由于向上的error线的会被后面的Bar遮盖,然后下面的error线由于arrayminus=[i-j for i,j in zip(sumList,down_error)]导致大部分时间说负值,也不会显示。
1 | fig = go.Figure() |
Candlestick
类似股票上下跳动的浮标被称为”Candlestick”(蜡烛图)或”OHLC”(开盘-最高-最低-收盘)图表。
需要进一步的研究学习
暂无
遇到的问题
暂无
开题缘由、总结、反思、吐槽~~
参考文献
上面回答部分来自ChatGPT-3.5,暂时没有校验其可靠性(看上去貌似说得通)。
[1] Saket, B., Endert, A. and Demiralp, Ç., 2018. Task-based effectiveness of basic visualizations.IEEE transactions on visualization and computer graphics,25(7), pp.2505-2512.
解释性语言
解释型语言没有严格编译汇编过程,由解释器将代码块按需要变运行边翻译给机器执行。因此解释型语言一度存在运行效率底,重复解释的问题。但是通过对解释器的优化!可以提高解释型语言的运行效率。
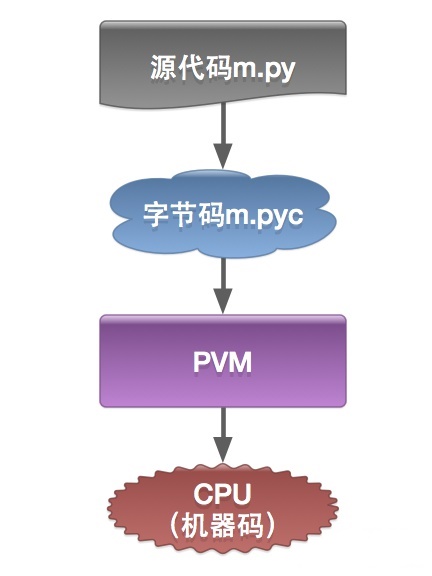
Python 与大多数解释型语言一样,确实是将源代码编译为一组虚拟机指令,并且 Python 解释器是针对相应的虚拟机实现的。这种中间格式被称为 “字节码”。
Python 字节码
Python 以 .pyc 结尾的 “ 字节码(bytecode)” 文件(二进制文件),一般位于__pycache__ 的子目录中,可以避免每次运行 Python 时去重新解析源代码。
1 | python -m py_compile file.py # 生成单个pyc文件 |
pyo优化文件
pyo文件是源代码文件经过优化编译后生成的文件,是pyc文件的优化版本。编译时需要使用-O和-OO选项来生成pyo文件。在Python3.5之后,不再使用.pyo文件名,而是生成文件名类似“test.opt-n.pyc的文件。
1 | python -O -m py_compile test.py |
Python 虚拟机
CPython 使用一个基于栈的虚拟机。(你可以 “推入” 一个东西到栈 “顶”,或者,从栈 “顶” 上 “弹出” 一个东西来)。
CPython 使用三种类型的栈:
- 调用栈(call stack)。这是运行 Python 程序的主要结构。它为每个当前活动的函数调用使用了一个东西 —— “ 帧(frame)”
- 在每个帧中,有一个 **计算栈(evaluation stack)**(也称为 数据栈(data stack))。这个栈就是 Python 函数运行的地方,运行的 Python 代码大多数是由推入到这个栈中的东西组成的,操作它们,然后在返回后销毁它们。
- 在每个帧中,还有一个**块栈(block stack)**。它被 Python 用于去跟踪某些类型的控制结构:循环、try / except 块、以及 with 块,全部推入到块栈中,当你退出这些控制结构时,块栈被销毁。
C vs Python
运行流程区别
python的传统运行执行模式:录入的源代码转换为字节码,之后字节码在python虚拟机中运行。代码自动被编译,之后再解释成机器码在CPU中执行。
c编译器直接把c源代码编译成机器码。过程比python执行过程少了字节码生成和虚拟机执行字节码过程。所以自然比python快。
深、浅拷贝
1 | list.append('Google') ## 使用 append() 添加元素 |
逻辑
setup
setup安装包的过程,请看pip package一文。
__init__.py
__init__.py文件在 Python 包结构中扮演着重要角色,但是否必须存在取决于你使用的 Python 版本和具体的使用场景。
Python 2:
__init__.py是必需的。它标志着一个目录是一个 Python 包,允许该目录中的模块被导入。
Python 3:
- 隐式命名空间包:从 Python 3.3 开始,
__init__.py不再是必需的。Python 3 支持隐式命名空间包(Implicit Namespace Packages),这意味着即使没有__init__.py文件,目录也可以被视为包并进行导入。 - 显式初始化逻辑:尽管
__init__.py不再是必需的,但它仍然是推荐的做法,特别是在需要执行包级别的初始化逻辑时。
- 隐式命名空间包:从 Python 3.3 开始,
import
命名空间(namespace)可以基本理解成每个文件是一个,通过import来使用
触发 __init__.py
- 当你导入一个包时,Python 会执行该包目录下的
__init__.py文件。如果没有这个文件,Python 会认为这个目录不是一个包,因此import语句会失败。 __init__.py负责初始化这个包,可以定义一些包级别的变量、函数或导入包的其他子模块。
行为:
- 每次导入包时,
__init__.py文件只会在第一次导入时被执行一次。如果模块已经被导入到当前的命名空间,再次import不会重新执行__init__.py,除非你强制重新加载(比如用importlib.reload())。 import的执行会触发模块的初始化,类似于 C++ 中构造函数的概念,但不是在对象级别,而是在模块级别。
1 | # example/__init__.py |
1 | import example |
绝对导入与相对导入
| 场景 | 导入方式 | 示例 |
|---|---|---|
| 导入标准库/第三方库 | 绝对导入 | import numpy as np |
| 导入项目根目录下的模块 | 绝对导入 | from my_project import config |
| 包内模块互相引用 | 相对导入 | from . import helper |
| 直接运行脚本 | 绝对导入 | python script.py |
| 作为包的一部分运行 | 相对导入或绝对导入 | python -m package.module |
在 Python 中,import 语句是否使用点号(.)取决于你使用的是 相对导入 还是 绝对导入,以及代码所处的上下文环境。以下是详细的解释:
关键点:
- 必须存在于包中(目录必须有
__init__.py)。 - 不能作为脚本直接运行(如
python main.py),否则会报错:1
ImportError: attempted relative import with no known parent package
- 适用于包内部的模块间引用,避免硬编码绝对路径。
入口
- 在Python中,
if __name__ == "__main__"这种写法通常出现在模块中,它的作用是控制模块的执行流程。 - 当一个模块被导入时,Python解释器会自动将这个模块的__name__属性设置为模块名称。但是如果模块是被直接运行的,则__name__属性会被设置为字符串__main__。
- 所以if name == “main”可以用来区分模块是被导入运行还是被直接运行:
- 如果模块是被导入的,if语句不会执行。因为模块的__name__不等于__main__。
- 如果模块是被直接运行的,if语句会执行。因为模块的__name__等于__main__。
清理与释放
程序结束时的清理行为(类似析构函数的操作)
在 Python 中,并没有像 C++ 那样显式的析构函数。模块或对象的清理一般通过以下方式实现:
- 对象的析构:当一个 Python 对象的引用计数降为零时,Python 会自动调用该对象的
__del__方法进行资源清理。这个机制类似于 C++ 的析构函数,但触发时机取决于 Python 的垃圾回收机制。
1 | class MyClass: |
- 模块的清理:当程序结束时,Python 会尝试清理已加载的模块。这个过程会调用模块内一些特殊的钩子函数来进行必要的清理工作。虽然 Python 没有直接为模块提供析构函数,但是你可以使用
atexit模块来注册一个函数,确保在程序结束时执行。
示例:使用 atexit 实现模块级别的清理操作
1 | import atexit |
输出:
1 | Program is running |
atexit模块允许你注册多个函数,它们会在解释器关闭之前按注册顺序依次执行。- 这种机制相当于 C++ 中的全局或静态对象析构函数的功能,确保在程序结束时执行一些清理工作。
模块的生命周期总结
- 初始化:当模块被导入时,Python 会执行模块的顶层代码,包括
__init__.py文件。这相当于模块的 “构造” 过程。 - 对象的析构:在 Python 中,通过垃圾回收机制和
__del__方法来管理对象的生命周期。通常情况下,当对象不再被引用时,会自动触发清理。 - 程序结束时的清理:Python 提供了
atexit模块来执行程序结束时的资源清理操作。你可以在模块中注册一些函数,确保在程序退出时执行清理任务。
语法
常见运算符
以下是 Python 和 C++ 中一些常见的运算符及其差异:
基本算术运算符
| 运算符 | 描述 | Python 示例 | C++ 示例 |
|---|---|---|---|
// |
整数除法 | a // b |
a / b (整数除法) |
% |
取模 | a % b |
a % b |
** |
幂 | a ** b |
pow(a, b) |
位运算符
| 运算符 | 描述 | Python 示例 | C++ 示例 |
|---|---|---|---|
& |
按位与 | a & b |
a & b |
| ` | ` | 按位或 | `a |
^ |
按位异或 | a ^ b |
a ^ b |
~ |
按位取反 | ~a |
~a |
<< |
左移 | a << b |
a << b |
>> |
右移 | a >> b |
a >> b |
赋值运算符
| 运算符 | 描述 | Python 示例 | C++ 示例 |
|---|---|---|---|
//= |
整数除法赋值 | a //= b |
a /= b (整数除法) |
%= |
取模赋值 | a %= b |
a %= b |
**= |
幂赋值 | a **= b |
a = pow(a, b) |
&= |
按位与赋值 | a &= b |
a &= b |
| ` | =` | 按位或赋值 | `a |
^= |
按位异或赋值 | a ^= b |
a ^= b |
<<= |
左移赋值 | a <<= b |
a <<= b |
>>= |
右移赋值 | a >>= b |
a >>= b |
逻辑运算符
| 运算符 | 描述 | Python 示例 | C++ 示例 |
|---|---|---|---|
and |
逻辑与 | a and b |
a && b |
or |
逻辑或 | a or b |
`a |
not |
逻辑非 | not a |
!a |
成员运算符
| 运算符 | 描述 | Python 示例 | C++ 示例 |
|---|---|---|---|
in |
成员 | a in b |
无直接等价 |
not in |
非成员 | a not in b |
无直接等价 |
身份运算符
| 运算符 | 描述 | Python 示例 | C++ 示例 |
|---|---|---|---|
is |
身份相同 | a is b |
无直接等价 |
is not |
身份不同 | a is not b |
无直接等价 |
装饰器 decorator
@能在最小改变函数的情况下,包装新的功能。^1
1 | def use_logging(func): |
- 问题:但是上面的代码会导致函数名被修改,所以不能再使用
foo.__name__变成了use_logging - 解决办法:加上
@wraps(func)
1 | def use_logging(func): |
下划线
单下划线、双下划线、头尾双下划线说明:
__foo__: 定义的是特殊方法,一般是系统定义名字 ,类似 init() 之类的。_foo: 以单下划线开头的表示的是 protected 类型的变量,即保护类型只能允许其本身与子类进行访问,不能用于 from module import *__foo: 双下划线的表示的是私有类型(private)的变量, 只能是允许这个类本身进行访问了。
函数传参
解包
- 解包是指将一个容器(如列表、元组或字典)的内容拆分并分配给多个变量或作为参数传递给函数。
- Python 提供了简洁的语法来实现这一点,使用
*和**分别解包可迭代对象和字典。
解包可迭代对象
解包字典
- 在函数定义中,
**用于将传入的关键字参数打包成一个字典; - 而在函数调用中,
**则用于将字典解包为关键字参数。
DEBUG
breakpoint()
python 能很轻易的
段错误
开启 Python 的调试模式:
通过设置环境变量启用 Python 的调试信息,这有助于捕获异常和详细的堆栈信息。1
export PYTHONMALLOC=debug
使用
faulthandler模块:
Python 提供了一个faulthandler模块,可以用来捕获段错误并打印堆栈信息。你可以在程序的开头添加以下代码来启用它:1
2import faulthandler
faulthandler.enable()这将会在段错误发生时输出堆栈跟踪。
查看 Python 调试输出:
启动 Python 程序时,通过faulthandler打印堆栈信息,或通过 GDB 调试 Python 解释器。如果 Python 解释器发生崩溃,faulthandler会帮助你定位错误。
卡住任务
pstack remote pid , 虽然官方没说,但是可以pip install pystack 或者 pip install pstack安装
py-spy dump –pid 831568
INFO
torch.profiler
如果程序能正常运行,优先推荐profiling理解程序逻辑。
打印当前堆栈
traceback.print_stack()
VizTracer时间性能分析
1 | from viztracer import VizTracer |
或者
1 | from viztracer import VizTracer |
mstx 逻辑监控工具
torch_npu.mstx.markrange_start等- 参考putils
mstt NPU vs GPU 性能对比工具
能实现到excel的输出,参考文档。
msprobe 精度对比工具
msprobe是MindStudio Training Tools工具链下精度调试部分的工具包,主要包括精度预检、溢出检测、精度比对和梯度监控等功能,目前适配PyTorch和MindSpore框架。具体参考文档。
两种dump方式
1 | # 导入工具的数据采集接口。 |
另一种方式直接save任意数据对象,参考文档
1 | from msprobe.pytorch import PrecisionDebugger |
可视化为excel
参考mstt文档
创建对比文件
1 | { |
执行 msprobe -f pytorch compare -i ./compare.json -o ./output
可视化为图节点
参考vllm文档
安装tensorborad插件 pip install tb-graph-ascend
创建compare.json
1 | { |
转换成对比图
1 | msprobe -f pytorch graph -i ./compare.json -o ./output |
启动tensorboard
1 | tensorboard --logdir output --host localhost --port 6501 |
icecream for debug
- 优雅打印对象:函数名,结构体
- 打印行号和栈(没用输入时
- 允许嵌套(会将输入传递到输出
- 允许带颜色
ic.format(*args)获得ic打印的文本 - debug
ic.disable()andic.enable() - 允许统一前缀
ic.configureOutput(prefix='Debug | ') - 不用每个文件import
1 | from icecream import ic |
如果你只想捕获标准错误的输出,并将其保存到日志文件,可以使用以下命令:

1
python3.8 setup.py build bdist_wheel 1>&2 | tee compile.log


或将 `stderr` 和 `stdout` 单独重定向:

1
python3.8 setup.py build bdist_wheel 2>compile.log
性能优化 与 可视化
定位 Python 中 setup.py 脚本运行缓慢的 热点,可以通过多种方式进行性能分析,具体步骤取决于你想了解的性能细节。以下是几种常见的方法来定位性能瓶颈。
方法 1: 使用 cProfile 进行性能分析
cProfile 是 Python 标准库中用于进行性能分析的工具。你可以用它来跟踪 setup.py 执行时的函数调用并找到性能瓶颈。
cProfile + snakeviz + gprof2dot
1 | ./gprof2dot.py -f pstats Diff.status | dot -Tpng -o ./output/Diff.png |
1.1 使用 cProfile 分析 setup.py
你可以通过 cProfile 运行 setup.py 并生成分析报告:
1 | python -m cProfile -o setup.prof setup.py install |
这将运行 setup.py 并将性能分析结果保存到 setup.prof 文件中。
1.2 可视化分析报告
使用 pstats 或者第三方工具 snakeviz 来分析 setup.prof:
使用
pstats来查看分析结果:1
python -m pstats setup.prof
然后,你可以在
pstats交互式界面中输入命令,比如:sort cumtime按总耗时排序。stats查看函数调用的分析结果。
安装
snakeviz来生成Web图形化报告:1
pip install snakeviz
运行
snakeviz来可视化分析结果:1
snakeviz setup.prof # deploy to 127.0.0.1:8080
这样可以生成一个图形化的界面,显示每个函数的执行时间以及调用关系,让你更直观地看到性能瓶颈。
使用 gprof2dot 生成调用关系图片:
安装 gprof2dot 工具:
pip install gprof2dot使用 gprof2dot 将 cProfile 生成的 output.prof 转换为 .dot 文件:
gprof2dot -f pstats output.prof | dot -Tsvg -o output.svg这里的 -f pstats 表示输入的格式是 cProfile 生成的 pstats 文件。这个命令会将结果转换为 SVG 格式的火焰图,保存为 output.svg。
打开生成的 SVG 文件,查看火焰图。
生成火焰图: flameprof
- 正常的火焰图说明了上到下的调用关系,倒置火焰图说明了底层最耗时的元素。
python flameprof.py input.prof > output.svg
生成火焰图(有详细文件路径): flamegraph
flameprof --format=log requests.prof | xxx_path/flamegraph.pl > requests-flamegraph.svg
方法 3: 使用 line_profiler 进行逐行性能分析
如果你想深入了解 setup.py 的某个函数或一组函数的逐行性能,可以使用 line_profiler 工具来分析代码的逐行执行时间。
3.1 安装 line_profiler
1 | pip install line_profiler |
3.2 添加装饰器
首先,在 setup.py 中找到你想要分析的函数,添加 @profile 装饰器(在 line_profiler 中的分析模式下使用):
1 |
|
3.3 运行 line_profiler
你可以使用 kernprof.py 来运行 setup.py 并生成逐行性能报告:
1 | kernprof -l -v setup.py install |
这将运行 setup.py 并生成一份逐行性能分析报告,显示每一行代码的耗时。
方法 4: 使用 Py-Spy 进行实时性能分析(推荐!!!)
Py-Spy 是一个 Python 的取样分析器,它可以在不修改代码的情况下对 Python 程序进行性能分析,并生成实时的性能报告。
4.1 安装 Py-Spy
1 | pip install py-spy |
4.2 运行 Py-Spy 对 setup.py 进行分析
你可以在执行 setup.py 的同时运行 Py-Spy 进行取样分析:
1 | py-spy top -- python setup.py install |
这会生成一个实时的报告,类似于 top 命令,显示当前正在运行的 Python 函数以及其消耗的 CPU 时间。
4.3 生成火焰图
如果你希望生成一个更直观的火焰图,可以使用 py-spy 生成火焰图文件:
1 | py-spy record -o profile.svg -- python setup.py install |
然后你可以打开 profile.svg 文件,查看一个交互式的火焰图,清晰展示函数调用的时间分布。
方法 5: 使用 strace 分析系统调用
如果 setup.py 涉及大量的 I/O 操作(比如读写文件或安装依赖包),可能是这些操作导致了性能瓶颈。你可以使用 strace 来分析 setup.py 的系统调用,找到 I/O 操作的瓶颈。
1 | strace -tt -T -o strace.log python setup.py install |
-tt选项会显示每个系统调用的时间戳。-T会显示每个系统调用耗时。-o将结果输出到strace.log文件中。
通过查看 strace.log,你可以找出系统调用中哪些操作耗时过长。
总结
- 使用
cProfile或Py-Spy进行函数级别的性能分析,找出执行慢的函数。 - 如果需要更细粒度的逐行分析,使用
line_profiler来分析慢的部分。 - 如果怀疑是 I/O 问题,用
strace来检查系统调用。 - 使用
time在脚本中插入计时代码,快速定位长时间的执行步骤。
这些工具可以帮助你定位和修复 setup.py 运行缓慢的热点。
CI
doctest
函数的单元测试
虚拟环境venv
1 | python3 -m venv name |
实践
数据快速写入和读取文件
任意变量使用pickle
1 | # 使用二进制 |
可以序列化的使用json
1 | import json |
多个变量
1 | # 将多个变量组织成字典或列表 |
参考文献
开发基础
size 大小
1 | len(day) |
空值判断
strings, lists, tuples
1 | # Correct: |
中断捕获
1 | try: |
for
间隔值
调参需要测试间隔值
1 | for i in range(1, 101, 3): |
遍历修改值
- 使用
enumerate函数结合for循环遍历 list,以修改 list 中的元素。 enumerate函数返回一个包含元组的迭代器,其中每个元组包含当前遍历元素的索引和值。在 for 循环中,我们通过索引i修改了列表中的元素。
1 | # 对于 二维list appDataDict |
itertools
itertools — 为高效循环而创建迭代器的函数
1 | for a,b,c in permutations((a,b,c)): |
小数位
x = round(x,3)# 保留小数点后三位
String 字符串
1 | %c 格式化字符及其ASCII码 |
1 | print("My name is %s and weight is %d kg!" % ('Zara', 21)) |
string <-> list
' '.join(pass_list) and pass_list.split(" ")
对齐"\n".join(["%-10s" % item for item in List_A])
开头判断
1 | text = "Hello, world!" |
格式化
Python2.6 开始,通过 {} 和 : 来代替以前的 %
1 | >>>"{} {}".format("hello", "world") # 不设置指定位置,按默认顺序 |
数字处理
1 | print("{:.2f}".format(3.1415926)) # 保留小数点后两位 |
NumPy
容器:List
https://www.runoob.com/python/python-lists.html
容器:元组Tuple
- 元组和列表类似,但是不同的是元组不能修改,但可以对元组进行连接组合,元组使用小括号。
- 元组中只包含一个元素时,需要在元素后面添加逗号,否则括号会被当作运算符使用。
1 | #创建元组 |
容器:Dict
初始化
1 | tinydict = {'a': 1, 'b': 2, 'b': '3'} |
empty dict
1 | a= {} |
1 | a_dict = {'color': 'blue'} |
删
1 | del tinydict['Name'] # 删除键是'Name'的条目 |
改
1 | tinydict = {'Name': 'Zara', 'Age': 7, 'Class': 'First'} |
查
容器:set
无序不重复序列
初始化
1 | a= set() # 空set |
增
1 | thisset.add("Facebook") |
删
1 | s.remove( x ) |
改
类型转换
list2set
1 | setL=set(listV) |
set2list
1 | my_set = {'Geeks', 'for', 'geeks'} |
参考文献
https://blog.csdn.net/weixin_63719049/article/details/125680242
pattern
1 | ^ 匹配字符串的开头 |
重复
1 | re* 匹配0个或多个的表达式。 |
match exactlly str
1 | # find should use \ to represent the (6|12|3) |
re.match与re.search的区别
re.match只匹配字符串的开始,如果字符串开始不符合正则表达式,则匹配失败,函数返回None;
而re.search匹配整个字符串,直到找到一个匹配。
re.match函数
从字符串的起始位置匹配
1 | re.match(pattern, string, flags=0) |
flags
多个标志可以通过按位 OR(|) 它们来指定。如 re.I | re.M被设置成 I 和 M 标志:
1 | re.I 使匹配对大小写不敏感 |
group
1 | matchObj = re.match( r'(.*) are (.*?) .*', line, re.M|re.I) |
打印部分内容
1 | matchObj.group() : Cats are smarter than dogs |
re.sub 替换
findall
返回元组,可以指定开始,与结束位置。
1 | result = re.findall(r'(\w+)=(\d+)', 'set width=20 and height=10') |
实例:objdump结果只提取汇编的命令
1 |
|
re.split
需要进一步的研究学习
暂无
遇到的问题
暂无
开题缘由、总结、反思、吐槽~~
参考文献
https://blog.csdn.net/weixin_39594191/article/details/111611346
简介
Python从设计之初就已经是一门面向对象的语言,正因为如此,在Python中创建一个类和对象是很容易的。
面向对象技术简介
类(Class): 用来描述具有相同的属性和方法的对象的集合。它定义了该集合中每个对象所共有的属性和方法。对象是类的实例。
实例化:创建一个类的实例,类的具体对象。
方法:类中定义的函数。
- 方法重写:如果从父类继承的方法不能满足子类的需求,可以对其进行改写,这个过程叫方法的覆盖(override),也称为方法的重写。
- 继承:即一个派生类(derived class)继承基类(base class)的字段和方法。继承也允许把一个派生类的对象作为一个基类对象对待。例如,有这样一个设计:一个Dog类型的对象派生自Animal类,这是模拟”是一个(is-a)”关系(例图,Dog是一个Animal)。
对象:通过类定义的数据结构实例。对象包括两个数据成员(类变量和实例变量)和方法。
- 类变量:类变量在整个实例化的对象中是公用的。类变量定义在类中且在函数体之外。类变量通常不作为实例变量使用。
- 实例变量:在类的声明中,属性是用变量来表示的。这种变量就称为实例变量,是在类声明的内部但是在类的其他成员方法之外声明的。
何时使用类
- 数据与操作紧密相关
- 对象有许多状态需要维护,可以使用类中的属性来保存状态。
- 需要生成多个仅在部分属性不同的实例,可以使用类作为模板。
- 不同对象存在公共parent-child的层次关系,可以使用继承来复用代码。
- 隐藏对象的实现细节,只对外公开接口。
类变量 与 实例变量
在Python中,类变量和实例变量是两个不同的概念:
- 类变量(Class Variable)
- 定义在类内部,但不在任何方法之内
- 被该类的所有实例对象所共享
- 可以通过类名或实例对象访问
- 用于定义与这个类相关的特征或属性
- 实例变量(Instance Variable)
- 定义在类内部的方法之内
- 每个实例对象拥有属于自己的变量副本
- 只能通过实例对象访问
- 用于定义实例对象的个性化特征或状态
例如:
1 | class Person: |
综上,类变量用于定义类的通用属性,实例变量用于定义实例的独特属性。区分二者是理解Python面向对象的关键。
创建
1 | class Employee: |
类函数必有参数 ‘self’
必须有一个额外的第一个参数名称, 按照惯例它的名称是 self,self 不是 python 关键字,换成其他词语也行。
创建实例对象与访问
1 | emp1 = Employee("Zara", 2000) |
继承
通过继承创建的新类称为子类或派生类,被继承的类称为基类、父类或超类。
继承语法 class 派生类名(基类名)
调用基类
调用基类的方法时,需要加上基类的类名前缀,且需要带上 self 参数变量。区别在于类中调用普通函数时并不需要带上 self 参数
,这点在代码上的区别如下:
1 | class Base: |
在Derived类中:
调用Base基类的方法base_method(),需要写成Base.base_method(self)
调用普通函数print(),直接写函数名即可
区别在于:
- 调用基类方法需要指明方法所属的基类
- 基类方法需要传入self,指代实例自己
而对于普通函数,只需要直接调用即可,不需要self参数。
这与Python的名称空间和面向对象实现有关,是理解Python类继承的关键点。
运算符重载
1 | __init__ : 构造函数,在生成对象时调用 |
+=
在Python中可以通过特殊方法__iadd__来对+=符号进行重载。
__iadd__需要定义在类中,用于指定+=操作时的具体行为。例如:
1 | class Vector: |
这里我们定义了__iadd__方法,用于实现两个Vector对象使用+=时的相加操作。
__iadd__方法的参数是另一个要相加的对象,在方法内部我们实现了两个向量的分量相加,并返回self作为结果。这样就实现了+=的运算符重载。
此外,Python还提供了__add__特殊方法用于重载+符号,但是__iadd__和__add__有以下区别:
- __add__返回一个新的对象,不改变原有对象。
- __iadd__在原有对象的基础上进行操作,并返回对原对象的引用。
所以对可变对象进行+=操作时,通常需要实现__iadd__方法。
参考文献
全局解释器锁(GIL,Global Interpreter Lock)
Python代码的执行由Python虚拟机(解释器)来控制。
对Python虚拟机的访问由全局解释器锁(GIL)来控制,正是这个锁能保证同时只有一个线程在运行。所以就会出现尽管你设置了多线程的任务,但是只能跑一个的情况。
但是I/O密集的程序(爬虫)相对好一点,因为I/O操作会调用内建的操作系统C代码,所以这时会释放GIL锁,达到部分多线程的效果。
通常我们用的解释器是官方实现的CPython,要真正利用多核,除非重写一个不带GIL的解释器。
Latent Dirichlet Allocation (2003)
简介
该篇论文于2003年发表在“Journal of Machine Learning Research”期刊上,迄今引用次数已超过15000次,可见该论文对后来相关研究工作的影响之大。
首次正式将主题以隐变量的形式引入,形成一个三层贝叶斯模型,并且相比于之前和它最接近的pLSI文本模型,LDA的主题选取不再受训练集文本内容的束缚,是一个完全非监督且依据多个主题进行聚类的机器学习、数据挖掘领域的算法。
现实意义
在推荐系统的研究中,利用评论文本信息来提升推荐性能是近3-4年的一个热门研究领域,LDA及其改良的文本模型则是用来挖掘评论文本的主要方式。
早期文本模型
- TF-IDF文本模型(矩阵表示)
- LSI文本模型
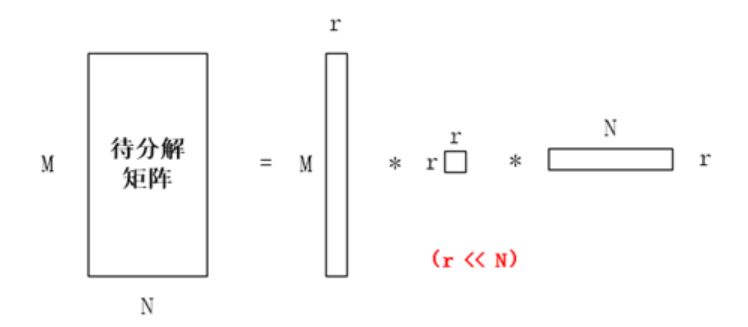
- 第一个子矩阵代表了词与主题的关系,第二个子矩阵代表了主题本身,第三个子矩阵代表了主题与文档之间的关系。
LDA的建模介绍
- 用来训练文档的是基本块
- 每条指令说word
- 柏松分布
用变分推理求解LDA模型的参数
最重要的是LDA模型的两个参数,确定了后能在未知的文本里提取主题
Gensim简介、LDA编程实现、LDA主题提取效果图展示
- 统计词语出现的频率
- 为什么例子里的没有迭代次数呢?
- 调研为什么要pytorch tenceflow
需要进一步的研究学习
暂无
遇到的问题
暂无
开题缘由、总结、反思、吐槽~~
参考文献
https://zhuanlan.zhihu.com/p/28777266
https://blog.csdn.net/fish0058/article/details/25075591
https://blog.csdn.net/anqiu4023/article/details/102275607
常见的仿站软件尝试
- wget -c -r -np -k -L -p 递归下载
- webCopy
- WinHTTrack
- Octoparse
- Teleport pro
遇到的问题
尝试后下载了一些html\css\js文件。但是没有达到我的要求。
我猜测的爬取原理,根据网站返回的index.html以及文件里指向的新文件路径进行递归下载。
这样的问题有:
- 无法对json文件里指向的材质包路径进行递归下载
- 无法读取指定网站文件夹的目录,导致不知道文件夹里有什么文件
- 假如有ftp://可能可以
需要进一步的研究学习
- 通过python实现对json文件里指向的材质包路径进行递归下载(感觉只能半自动)
- 读取指定网站文件夹的目录
开题缘由、总结、反思、吐槽~~
在找live2d模型的时候找到了 https://github.com/Eikanya/Live2d-model ,然后其中有个HSO的demo网站https://l2d.alg-wiki.com/。
然后一开始我想在自己页面做一个仿站,后来了解后只想把他里面的live2d的材质数据、贴图等爬下来。但是遇到了几个问题。