简介 TLB的介绍,请看
页表相关 理论基础 大体上是应用访问越随机, 数据量越大,pgw开销越大。
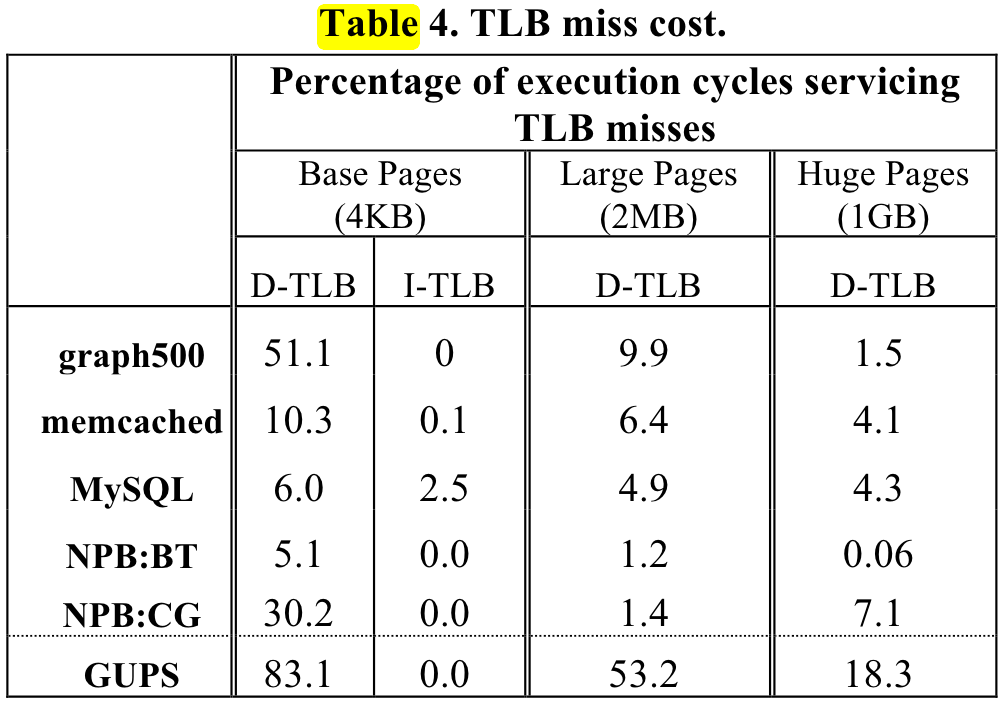
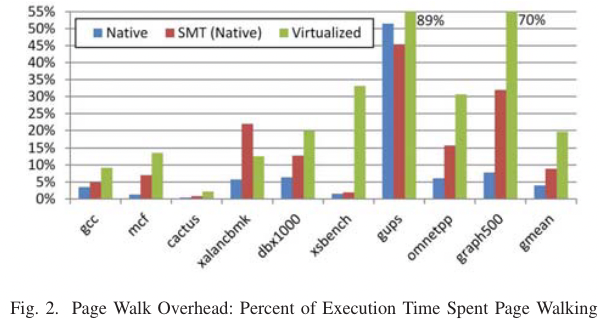
ISCA 2013 shows the pgw overhead in big memory servers.
or ISCA 2020 Guvenilir 和 Patt - 2020 - Tailored Page Sizes.pdf
机器配置 1 2 3 4 5 6 7 8 9 10 11 12 13 14 15 16 17 18 19 20 21 22 23 24 25 26 27 28 29 30 31 32 33 34 35 $ cpuid -1 -l 2 CPU: 0x63: data TLB: 2M/4M pages, 4-way, 32 entries data TLB: 1G pages, 4-way, 4 entries 0x03: data TLB: 4K pages, 4-way, 64 entries 0x76: instruction TLB: 2M/4M pages, fully, 8 entries 0xff: cache data is in CPUID leaf 4 0xb5: instruction TLB: 4K, 8-way, 64 entries 0xf0: 64 byte prefetching 0xc3: L2 TLB: 4K/2M pages, 6-way, 1536 entries cpuid -1 |grep TLB -A 10 -B 5 L1 TLB/cache information: 2M/4M pages & L1 TLB (0x80000005/eax): instruction instruction associativity = 0xff (255) data data associativity = 0xff (255) L1 TLB/cache information: 4K pages & L1 TLB (0x80000005/ebx): instruction instruction associativity = 0xff (255) data data associativity = 0xff (255) L2 TLB/cache information: 2M/4M pages & L2 TLB (0x80000006/eax): instruction instruction associativity = 2-way (2) data data associativity = 4-way (4) L2 TLB/cache information: 4K pages & L2 TLB (0x80000006/ebx): instruction instruction associativity = 4-way (4) data data associativity = 8-way (6)
OS config default there is no hugopage(usually 4MB) to use.
1
2
3
4
5
6
7
8
9
10
$ cat /proc/meminfo | grep huge -i AnonHugePages: 8192 kB ShmemHugePages: 0 kB FileHugePages: 0 kB HugePages_Total: 0 HugePages_Free: 0 HugePages_Rsvd: 0 HugePages_Surp: 0 Hugepagesize: 2048 kB Hugetlb: 0 kB
explained is here .
设置页表大小 other ways: change source code
way1: Linux transparent huge page (THP) support allows the kernel to automatically promote regular memory pages into huge pages, cat /sys/kernel/mm/transparent_hugepage/enabled but achieve this needs some details .
way2: Huge pages are allocated from a reserved pool which needs to change sys-config . for example echo 20 > /proc/sys/vm/nr_hugepages. And you need to write speacial C++ code to use the hugo page
1 2 3 4 mount -t hugetlbfs \ -o uid=<value>,gid=<value>,mode=<value>,pagesize=<value>,size=<value>,\ min_size=<value>,nr_inodes=<value> none /mnt/huge
without recompile But there is a blog using unmaintained tool hugeadm and iodlr library to do this.
1
2
3
sudo apt install libhugetlbfs-binsudo hugeadm --create-global-mountssudo hugeadm --pool-pages-min 2M:64
So meminfo is changed
1
2
3
4
5
6
7
8
9
10
$ cat /proc/meminfo | grep huge -i AnonHugePages: 8192 kB ShmemHugePages: 0 kB FileHugePages: 0 kB HugePages_Total: 64 HugePages_Free: 64 HugePages_Rsvd: 0 HugePages_Surp: 0 Hugepagesize: 2048 kB Hugetlb: 131072 kB
using iodlr library
应用测量 Measurement tools from code
1 2 3 4 5 6 $ ./investigation/pagewalk/tlbstat -c '/staff/shaojiemike/github/sniper_PIMProf/PIMProf/gapbs/sssp.inj -f /staff/shaojiemike/github/sniper_PIMProf/PIMProf/gapbs/benchmark/kron-20.wsg -n1' command is /staff/shaojiemike/github/sniper_PIMProf/PIMProf/gapbs/sssp.inj -f /staff/shaojiemike/github/sniper_PIMProf/PIMProf/gapbs/benchmark/kron-20.wsg -n1K_CYCLES K_INSTR IPC DTLB_WALKS ITLB_WALKS K_DTLBCYC K_ITLBCYC DTLB% ITLB% 324088 207256 0.64 733758 3276 18284 130 5.64 0.04 21169730 11658340 0.55 11802978 757866 316625 24243 1.50 0.11
平均单次开销(开始到稳定):50 cycle ,itlb miss read need 4027 cycle
案例的时间分布:
读数据开销占比不大,2.5%左右
pagerank等图应用并行计算时,飙升至 22%
但是gemv 在65000 100000超内存前,即使是全部在计算,都是0.24%
原因:访存模式:图应用的访存模式通常是随机的、不规则的。它们不像矩阵向量乘法(gemv)等应用那样具有良好的访存模式,后者通常以连续的方式访问内存。连续的内存访问可以利用空间局部性,通过预取和缓存块的方式减少TLB缺失的次数。
github - GUOPS can achive 90%
DAMOV - ligra - pagerank can achive 90% in 20M input case
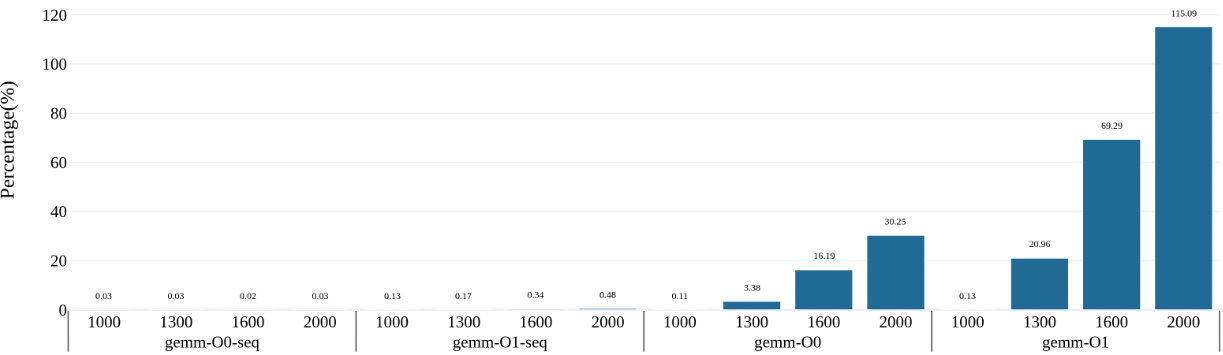
gemm
nomal gemm can achive 100% some situation
matrix too big can not be filled in cache, matrix2 access jump lines so always cache miss
O3 flag seems no time reduce, beacause there is no SIMD assembly in code
memory access time = pgw + tlb access time + load data 2 cache time
the gemm‘s core line is
1
2
3
4
5
6
7
8
9
10
11
12
for (int i=0 ; i<N; i++){ for (int j=0 ; j<N; j++){ for (int l=0 ; l<N; l++){ ans[i * N + j] += matrix1[i * N + l] * matrix2[j * N + l]; } } }
and real time breakdown is as followed. to do
first need to perf get the detail time
bigJump manual code to test if tlb entries is run out
1
2
3
4
5
6
7
8
9
10
11
12
13
14
$ ./tlbstat -c '../../test/manual/bigJump.exe 1 10 100' command is ../../test/manual/bigJump.exe 1 10 100K_CYCLES K_INSTR IPC DTLB_WALKS ITLB_WALKS K_DTLBCYC K_ITLBCYC DTLB% ITLB% 2002404 773981 0.39 104304528 29137 2608079 684 130.25 0.03 $ perf stat -e mem_uops_retired.all_loads -e mem_uops_retired.all_stores -e mem_uops_retired.stlb_miss_loads -e mem_uops_retired.stlb_miss_stores ./bigJump.exe 1 10 500 Number read from command line: 1 10 (N,J should not big, [0,5] is best.) result 0 Performance counter stats for './bigJump.exe 1 10 500' : 10736645 mem_uops_retired.all_loads 532100339 mem_uops_retired.all_stores 57715 mem_uops_retired.stlb_miss_loads 471629056 mem_uops_retired.stlb_miss_stores
In this case, tlb miss rate up to 47/53 = 88.6%
Big bucket hash table using big hash table
other apps Any algorithm that does random accesses into a large memory region will likely suffer from TLB misses. Examples are plenty: binary search in a big array, large hash tables, histogram-like algorithms, etc.
需要进一步的研究学习 暂无
遇到的问题 暂无
开题缘由、总结、反思、吐槽~~ 参考文献 上面回答部分来自ChatGPT-3.5 ,没有进行正确性的交叉校验。
无